- Comprá cripto
- Mercados
- Contratos
- Spot
- Copy trading
 WE-Launch
On-chain Data Academy (Part 1): Do you know what the average market-wide BTC cost is?
Original Article Title: "On-Chain Data School (Part 1): Do You Know What the Market-Wide BTC Average Cost Is?"
Original Article Author: Mr. Berg, On-Chain Data Analyst
TLDR
· This article will introduce "one on-chain analysis concept" and "three on-chain data points"
· MVRV represents the market-wide profit state
· Realized Price represents the average cost of holding BTC for the entire market
· Realized Cap can be thought of as "how much money the market collectively spent to buy BTC"
What Is Realized Cap?
Realized Cap, also known as Realized Market Cap, refers to "multiplying each unit of BTC by the price at the last transfer, and then summing them up".
In simple terms: Each transfer can be seen as a "transaction", so multiplying the corresponding amount of BTC by the price at the last transfer is equivalent to the cost of that transaction. Adding up these costs gives you the Realized Cap.
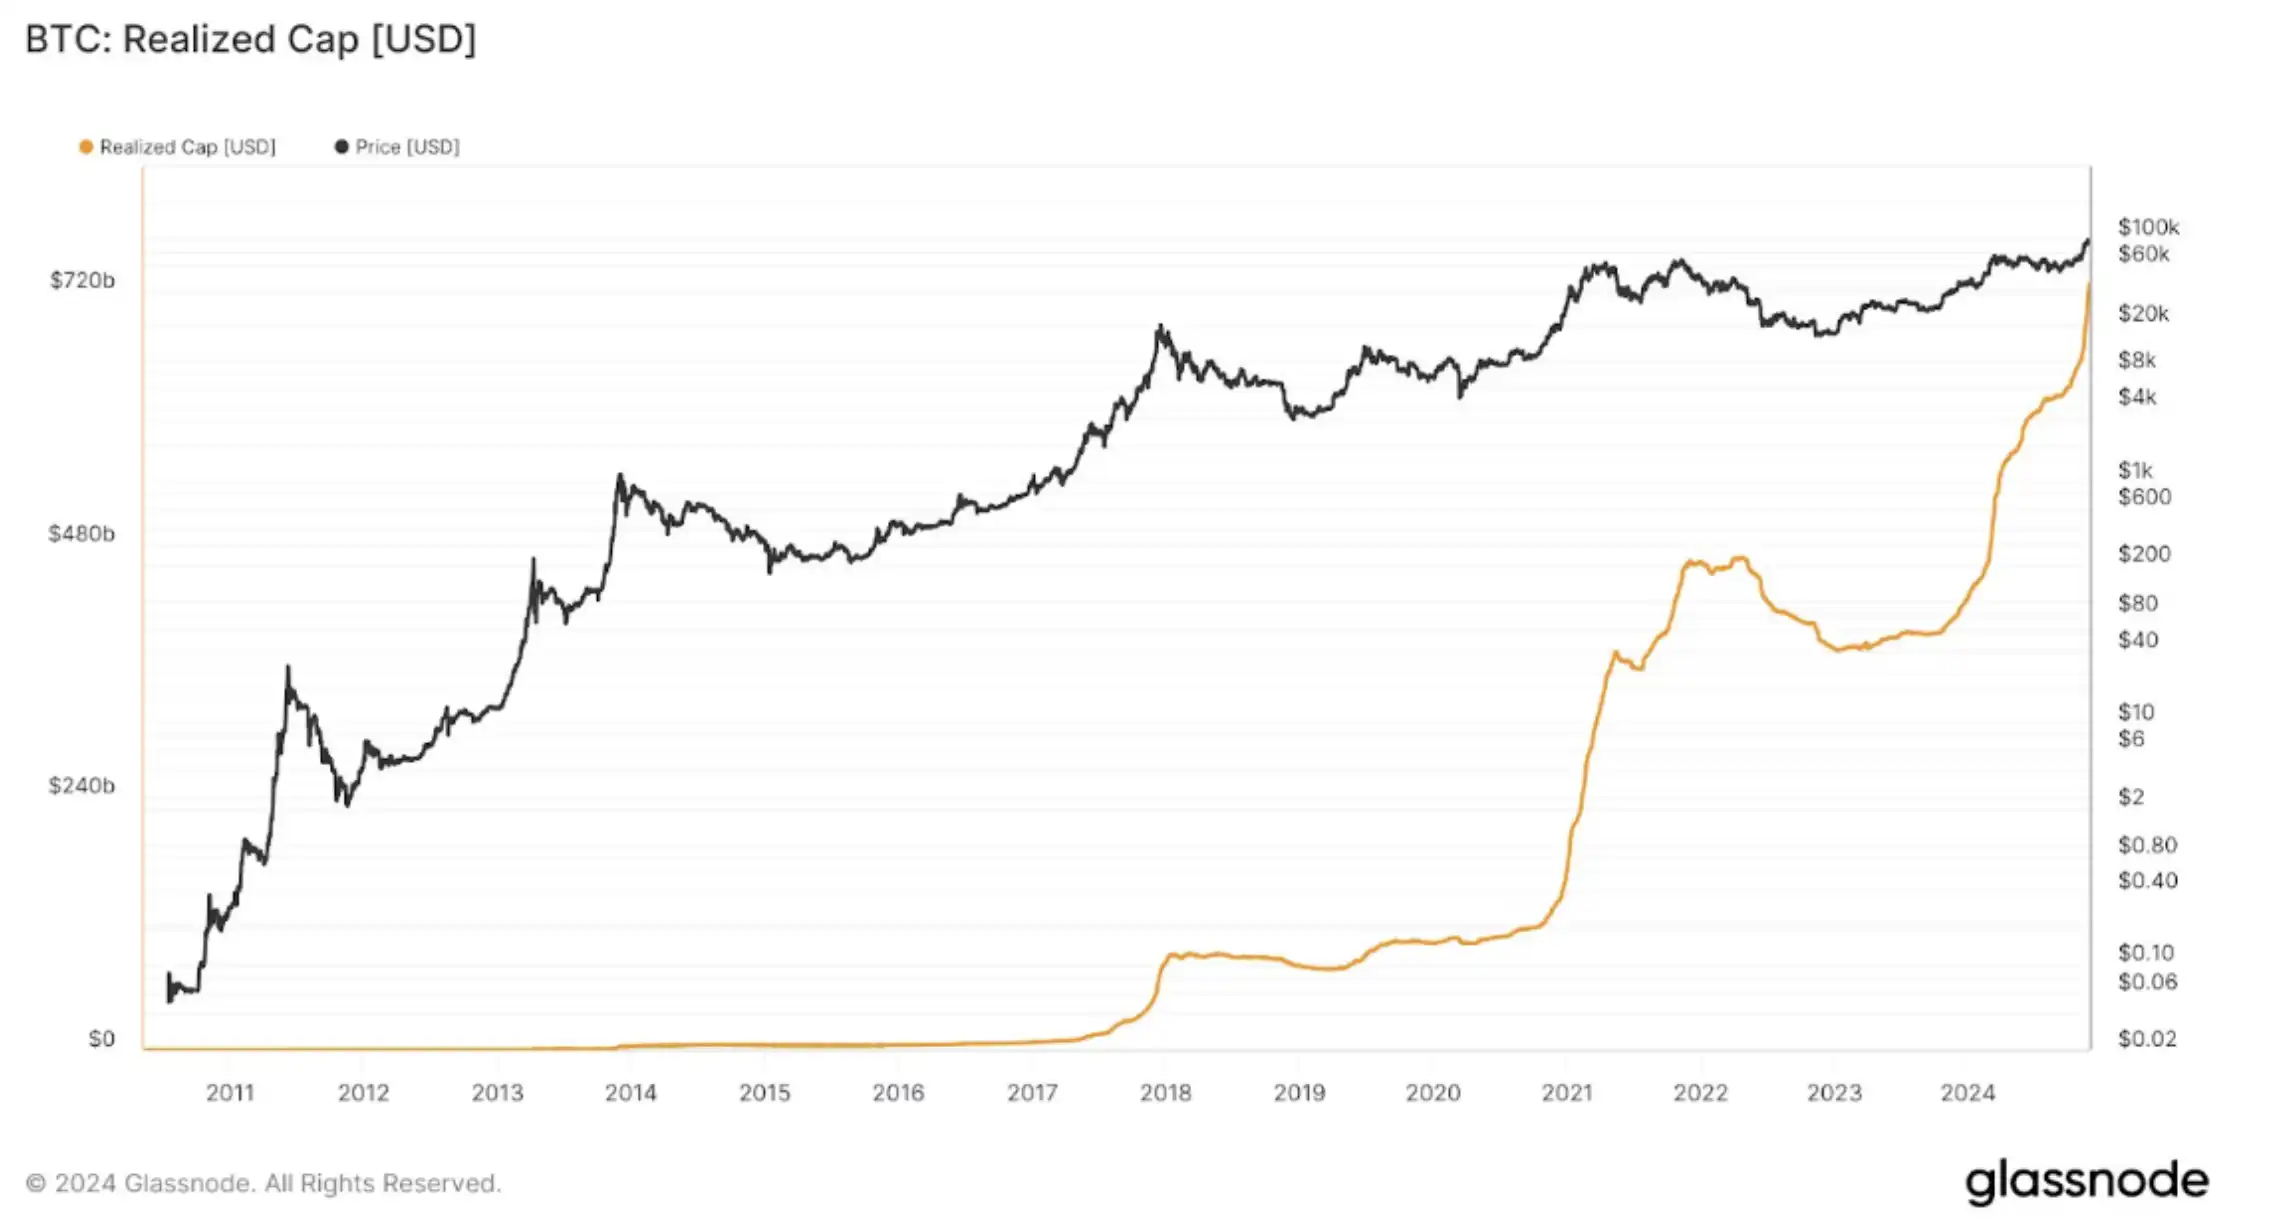
Realized Cap Chart
What Is Realized Price?
Realized Price (RP), also known as Realized Price, is the number obtained by dividing "Realized Cap by the current BTC circulating supply".
We can interpret this as: "Total cost of BTC purchased by the whole market / How many BTC were purchased".
In other words, this is the "average cost of BTC for the entire market". By the way, it's always a good buying opportunity when the price is below RP!

Realized Price Chart

(Price Below Realized Price)
What Is MVRV?
MVRV, short for MV divided by RV, represents the market's profitability status.
MV refers to the current BTC market value, i.e., "market price x circulating supply"; while RV is Realized Cap.
Moreover, if both the numerator and denominator of the formula are divided by the circulating supply, MVRV can also be expressed as "market price / RP." For example: if MVRV = 2, it represents an average market profitability of 100%.

MVRV Chart
Summary
The above is all the content of On-Chain Data School (Part One). For readers interested in delving deeper into on-chain data analysis, remember to track this series of articles!
If you want to see more analysis and educational content on on-chain data, feel free to follow my Twitter (X) account!
Hope this article has been helpful to you. Thank you for reading.
También te puede gustar
Ganadores
Últimas noticias cripto
La segunda edición del informe preliminar del evento de votación a gran escala "MEET48Best7", evento MEET48 dApp sube al primer lugar en el ranking Social Track UAW
La Agencia de Servicios Financieros de Japón está considerando exigir a las bolsas de criptomonedas que establezcan un fondo de reserva de seguridad para abordar el riesgo de piratería informática o vulnerabilidades de seguridad.
Una ballena gastó 8.000.000 USDC para comprar 2.700 ETH
「El Gran Corto」 Michael Burry Hace un Regreso, Publica Advertencia en Columna sobre Riesgo de Burbujas de IA
CZ niega rumor: Jackie Chan interpretará a CZ en la película biográfica documental de Netflix <em>Crypto Kingpin</em>
Atención al cliente:@weikecs
Cooperación comercial:@weikecs
Trading cuantitativo y MM:[email protected]
Servicios VIP:[email protected]