- Acheter crypto
- Marchés
- Futures
- Spot
- Copy trading
 WE-Launch
Exploring BTC On-Chain Data: Initial "Trend Decay" Signal Emerges
Original Author: Murphy, On-chain Data Analyst
Initial Signal of Stage-wise "Trend Decay" Identified for the First Time!
Preface
Looking back at this cycle, it has been very different from the past in many ways. For example, for the first time in a bull market cycle, we experienced a macro contraction combined with a significant election rally, for the first time we broke the previous all-time high before the halving, for the first time a spot ETF was formally recognized by traditional capital, for the first time there is hope of becoming a financial reserve asset in developed countries, bringing us endless expectations for the future...
Against this backdrop, I, like all of you, am extremely excited. However, I am well aware that while belief is essential, fundamentally I am a player. I did not enter the crypto space as a tourist but to make money; I am also a trend investor, not a cross-cycle investor, and everything I do is aimed at increasing the amount of BTC in my wallet, not just increasing its USD value.
I believe that any financial asset, trend, and cycle always objectively exist. It is fundamentally a relationship of supply and demand, a shift in sentiment, capital seeking profit, and above all, human nature! Therefore, I study on-chain data in the hope of analyzing the factors that influence trend and cycle shifts, making rational judgments, guiding trades, and allowing myself to earn money with a higher certainty than opening blind boxes.
That is, to grasp the trend, increase BTC holdings, and better prepare to embrace the boundless opportunities of the crypto market's future!
Main Content
Following BTC's historic high of $73,000 on March 13, 2024, a prolonged 7-month oscillating downtrend began, until a trend reversal occurred after testing the $60,000 psychological support on October 10, ushering in a new uptrend. Over the next 2 months from October to December, the data consistently showed a strong trend without any signs of decay.
On November 8, I wrote an article titled "Escape the Top Series 6" (link at the end of the article), mainly discussing the application method and underlying logic of data related to "Supply and Demand Relationship & Profit Realization." The final conclusion was that when the following "three elements" appeared simultaneously after BTC broke the previous all-time high, it could be used as a basis to judge a stage-wise peak:
1. Long-Term Holders (LTH) accelerating distribution, possibly nearing completion;
2. Massive profit-taking exits occurring at the same time;
3. As the price rises, the peak of profit-taking exits is decreasing.

(Figure 1)
As shown in Figure 1, long-term holders (LTH) began their second large-scale distribution behavior in this hot cycle starting from October 7th. This indicates an increasing market demand capable of absorbing excess supply. On November 14th, the first wave of massive profit-taking exits occurred, totaling $5.2 billion (labeled 1 in Figure 1), with BTC's price at $87,000 that day. As I have analyzed in a previous tweet, historically, when LTHs start distributing and the first wave of massive profits is realized, it is usually not the relative peak, making it not an ideal selling point.
Indeed, on November 22nd, the second wave of massive profit-taking exits worth $6.6 billion (labeled 2 in Figure 1) appeared, with BTC's price at $98,900. This time, a higher price emerged along with higher profit-taking, showcasing the characteristics of a strong trend. Therefore, on November 24th, I tweeted again: "Don't rush! Patience is needed now more than ever."
On December 6th, the third wave of massive profit-taking exits amounting to $6 billion (labeled 3 in Figure 1) occurred, which was smaller in scale compared to the second wave, with BTC's price at $99,900. This marked the first instance in this trend cycle where all three elements of the "triad of judgment" were met. That is, 1. LTH accelerated distribution, 2. accompanied by massive profit-taking exits, and 3. the price was higher but the peak profit was lower.
When all 3 conditions are met simultaneously, it indicates a sign of attenuation in the current strong trend!
In my data analysis system, I never draw conclusions easily based on the appearance of a single indicator or signal. To confirm the above, I need to integrate and observe several other data points (due to the limit on the number of images in tweets, I will not include the data chart from the previous cycle in the following analysis, only the current one).
1. Capital Inflow Situation

(Figure 2)
As shown in Figure 2, whenever the trend of incoming real capital begins to slow down, the momentum of BTC price growth will start to weaken. Until the capital inflow cannot sustain the price balance, a retracement will follow as expected. Similar situations have occurred in May 2021, November 2021, and April of this year.
During this trend from November 24th to December 7th, the overall scale of capital inflows is gradually decreasing. Although the price has not experienced a sharp correction, if another peak of capital inflow (higher than the previous high) does not occur in the short term, this downward trend will gradually affect the momentum of BTC price growth.
2. Evaluation of New Demand

(Chart 3)
As shown in Chart 3, the sudden surge in the bottom red waveform indicates a large amount of new demand entering the market in the short term. With the continuous influx of demand, BTC usually experiences a strong uptrend; similar situations have occurred in May 2017, November 2020, October 2021, and November 2023.
When the demand begins to wane, BTC will enter a consolidation period; if there is no new demand entering in the short term, the trend will gradually shift, and the market will enter a pullback phase (as indicated in Chart 3).
The sudden rise in the bottom blue line in the chart indicates that the short-term chips trapped at a high level have turned into long-term chips due to passive holding, which will represent the most emotionally unstable long-term holders in the future. Once the price rises again, they will become the primary selling pressure in the market.
Currently, we observe a decrease in market demand (as indicated in Chart 3), and this overall demand scale of this wave is slightly lower than in March of this year, only far surpassing March in sentiment.
3. Market Sentiment Dominance

(Chart 4)
We can clearly see who is dominating the current market from Chart 4. The red line is much higher than the blue and yellow lines, indicating that Asian investors are the main driving force. American investor sentiment only experienced a rapid rebound on December 5th, but unfortunately, it quickly returned to its original level the next day; European sentiment has remained flat throughout. After all, with the Christmas holiday approaching, the gradual withdrawal of sentiment dominance by European and American investors is understandable.
However, what we hope to see is whether the peak of capital inflow can be restored and whether continuous new demand can sustainably enter the market, providing fundamental support for BTC price growth. Ultimately, it still depends on American investors.
Final Thoughts
The shrinking of new demand, slowing capital inflow, accelerated distribution by Long-Term Holders (LTH), and a peak in profit-taking not as high as before... From observations of multiple data points, the conclusion that this round's trend in the "Supply-Demand Relationship & Profit-Taking" data is showing signs of decay is traceable and substantiated.
Seeing a signal does not necessarily mean an immediate pullback; sometimes, there may even be another push higher because market sentiment tends to have inertia.
What will I do? — Of course, I will start executing a phased profit-taking plan. This signal is the "sell point" I have been waiting for. During a bear market cycle, buy orders are phased in at several "buy points" based on indicator signals. Similarly, in a bull market cycle, there cannot be only a single "sell point." The key is to plan well and seize each occurrence of a "sell point."
What if my judgment is wrong? — There is no trading system in the world that is flawless and never makes mistakes. As long as it aligns with one's risk preference and profit expectation, is logical, executable, and can form a closed loop, it is a good system. Understanding goes only this far; money beyond understanding cannot be earned.
However, it is important to note that data cannot predict the future! It is also possible that the comprehensive data mentioned above may suddenly undergo a fundamental reversal due to some event, causing metrics such as capital inflow, new demand, emotion-driven forces, and profit-taking to start turning upwards again. In that case, pause the "phased profit-taking" plan and patiently wait for the next signal indication.
This is just my personal plan, which may not be correct, and certainly does not mean you should do the same. Everyone has different holding amounts, risk preferences, and understandings of the top range. My sharing is for data reference only and not investment advice!!
Vous pourriez aussi aimer
Comment l'IA aide les traders crypto à analyser les marchés, à gérer les risques et à trader plus intelligemment
Le trading de crypto ne consiste plus seulement à avoir une bonne idée, mais à s'exécuter de manière cohérente dans un marché qui ne s'arrête jamais. Avec l'augmentation des volumes de données et de la vitesse du marché, l'analyse manuelle traditionnelle atteint ses limites. L'IA aide les traders à dépasser ces limites en transformant la façon dont les marchés sont analysés, comment le sentiment est interprété et comment les risques sont contrôlés. Cet article explore comment l'IA remodèle le trading de crypto – et ce que cela signifie pour les traders aujourd'hui.

WEEX × LALIGA : Sept étoiles qui représentent une norme d’excellence commune
La véritable excellence dans le football n'est jamais accidentelle. Il repose sur la discipline, la constance et la capacité à livrer sous la pression – saison après saison. Les mêmes principes s'appliquent dans le trading professionnel, où les performances à long terme comptent plus que le momentum de courte durée. En tant que partenaire régional officiel de LALIGA, WEEX met en avant sept joueurs exceptionnels qui incarnent l'esprit de compétition et l'attrait mondial de la ligue. Chacun apporte un style unique au terrain, mais tous partagent des valeurs qui s'alignent étroitement sur l'engagement de WEEX en matière de stabilité, de précision et d'exécution professionnelle. Ce partenariat repose sur des normes communes — où la cohérence et le contrôle définissent la performance sous la pression.

De Wuhan à la Silicon Valley, Manus l'a fait en seulement neuf mois.
Vous pouvez l'appeler un « wrapper », mais il s'est emballé jusqu'à Meta.

WEEX s'associe à LALIGA pour étendre sa portée mondiale et intégrer la crypto dans la culture sportive dominante
Hong Kong, le 1er janvier 2026. WEEX a conclu un nouveau partenariat avec LALIGA, en tant que partenaire régional officiel de LALIGA à Taïwan et à Hong Kong. L'accord amène WEEX dans le réseau de collaborateurs régionaux de LALIGA et ouvre la porte à de nouvelles façons d'engager les fans et les traders pendant la saison.
Trading crypto IA : Comment les traders appliquent réellement l'IA sur les marchés crypto réels
L'intelligence artificielle a dépassé le stade de l'expérimentation sur les marchés crypto. En 2025, les outils de trading basés sur l'IA sont de plus en plus utilisés par les traders qui souhaitent une meilleure discipline, une exécution plus rapide et une prise de décision plus structurée sur des marchés volatils. Ce guide explique comment l'IA est réellement utilisée dans le trading de crypto, étape par étape, en mettant l'accent sur la façon dont ces stratégies sont exécutées dans des environnements de trading réels.

Mise à jour du marché — 31 décembre
De la Corée du Sud et de l'OCDE à l'accélération de la mise en œuvre des cadres de réglementation et de conformité crypto, en passant par le développement simultané des ETF TAO, des technologies de confidentialité, du minage et des réserves de bitcoins, alors que les incidents de sécurité et les pertes financières continuent d'augmenter, le marché crypto est entré dans une nouvelle phase au milieu de multiples défis de « réglementation forte + évolution technologique + risques amplifiés ».
Quand tout le monde utilise le trading d'IA, où va Alpha crypto en 2026 ?
En 2025, le trading d'IA est devenu la solution par défaut, mais Alpha n'a pas disparu – il a été érodé par l'affluence, car des données, des modèles et des stratégies similaires font que les traders agissent de manière synchronisée et perdent de leur avantage.
Real Alpha est passé à des couches plus difficiles à copier comme les données comportementales et on-chain, la qualité d'exécution, la gestion des risques et le jugement humain dans les marchés extrêmes, où agir différemment – ou ne pas agir du tout – est plus important que de meilleures prévisions.

Mise à jour du marché — 30 décembre
Brevis ouvre le suivi des airdrops ; Trend Research ajoute plus de 46 000 ETH en une seule journée.
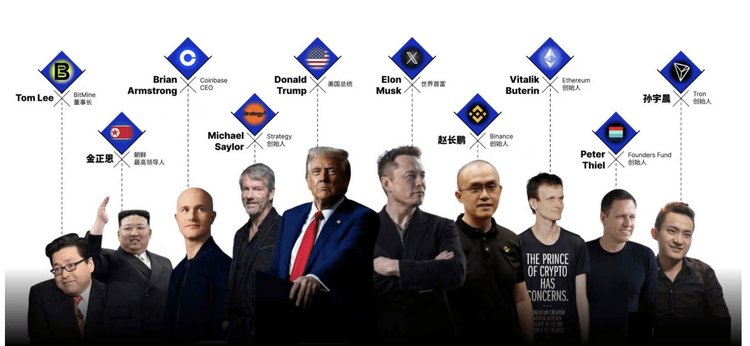
Dix personnes redéfinissent les limites de puissance de la crypto en 2025
De Wall Street à la Maison Blanche, de la Silicon Valley à Shenzhen, un nouveau réseau électrique se dessine.

Même Satoshi Nakamoto devrait rendre hommage au Dieu de la Richesse.
Le Feng shui est devenu la dernière ligne de défense psychologique.

WEEXPERIENCE Nuit des baleines : Trading IA, communauté crypto et marché crypto
Le 12 décembre 2025, WEEX a organisé WEEXPERIENCE Whales Night, un rassemblement communautaire hors ligne conçu pour rassembler les membres de la communauté crypto locale. L'événement a combiné le partage de contenu, des jeux interactifs et des présentations de projets pour créer une expérience hors ligne détendue et attrayante.
Risque de trading d'IA en cryptomonnaie : Pourquoi de meilleures stratégies de trading crypto peuvent-elles générer des pertes plus importantes ?
Le risque ne réside plus principalement dans une mauvaise prise de décision ou des erreurs émotionnelles. Il vit de plus en plus dans la structure du marché, les parcours d'exécution et le comportement collectif. Comprendre ce changement est plus important que de trouver la prochaine stratégie « meilleure ».
Les agents de l'IA remplacent-ils la recherche crypto ? Comment l'IA autonome remodele le trading crypto
L'IA passe de l'assistance aux traders à l'automatisation de l'ensemble du processus de recherche à l'exécution sur les marchés crypto. L'avantage est passé de l'information humaine aux pipelines de données, à la vitesse et aux systèmes d'IA prêts à être exécutés, ce qui fait des retards dans l'intégration de l'IA un désavantage concurrentiel.
Boots de trading et copy trading IA : Comment les stratégies synchronisées remodèlent la volatilité du marché crypto
Les traders crypto de détail sont confrontés depuis longtemps aux mêmes défis : mauvaise gestion des risques, entrées tardives, décisions émotionnelles et exécution incohérente. Les outils de trading IA promettaient une solution. Aujourd'hui, les systèmes de copy trading et les bots de cassage alimentés par l'IA aident les traders à dimensionner leurs positions, à définir des stops et à agir plus rapidement que jamais. Au-delà de la vitesse et de la précision, ces outils remodèlent tranquillement les marchés : les traders ne tradent pas seulement plus malin, ils évoluent de façon synchronisée, créant une nouvelle dynamique qui amplifie à la fois les risques et les opportunités.
Le trading d'IA en crypto expliqué : Comment le trading autonome remodele les marchés crypto et les plateformes d’échange crypto
L’IA Trading transforme rapidement le paysage crypto. Les stratégies traditionnelles peinent à suivre la volatilité constante de la crypto et la structure complexe du marché, tandis que l'IA peut traiter des données massives, générer des stratégies adaptatives, gérer les risques et exécuter des trades de manière autonome. Cet article guide les utilisateurs de WEEX sur ce qu'est le trading d'IA, pourquoi la crypto accélère son adoption, comment le secteur évolue vers des agents autonomes et pourquoi WEEX construit l'écosystème de trading d'IA de nouvelle génération.

Appelez à rejoindre AI Wars : WEEX Alpha Awakens – Tournoi mondial de trading d’IA avec une cagnotte de 880 000 $
Maintenant, nous lançons un appel aux traders d'IA du monde entier pour qu'ils rejoignent AI Wars : WEEX Alpha Awakens, un tournoi mondial de trading d'IA doté d'une cagnotte de 880 000 $.
Trading d'IA sur les marchés crypto : Des bots de trading automatisés aux stratégies algorithmiques
Le trading basé sur l'IA fait passer la crypto de la spéculation au détail à une concurrence de niveau institutionnel, où l'exécution et la gestion des risques comptent plus que dans le sens. À mesure que le trading de l'IA prend de l'ampleur, les risques systémiques et la pression réglementaire augmentent, faisant des performances à long terme, des systèmes robustes et de la conformité les principaux facteurs de différenciation.
Analyse du sentiment de l'IA et volatilité des cryptomonnaies : Ce qui fait bouger les prix crypto
Le sentiment lié à l'IA influence de plus en plus les marchés crypto, les changements d'attente liés à l'IA se traduisant par une certaine volatilité pour les principaux actifs numériques. Les marchés crypto ont tendance à amplifier les discours sur l'IA, permettant aux flux basés sur les sentiments de l'emporter sur les fondamentaux à court terme. Comprendre comment le sentiment IA se forme et se propage aide les investisseurs à mieux anticiper les cycles de risque et les opportunités de positionnement sur les actifs numériques.
Comment l'IA aide les traders crypto à analyser les marchés, à gérer les risques et à trader plus intelligemment
Le trading de crypto ne consiste plus seulement à avoir une bonne idée, mais à s'exécuter de manière cohérente dans un marché qui ne s'arrête jamais. Avec l'augmentation des volumes de données et de la vitesse du marché, l'analyse manuelle traditionnelle atteint ses limites. L'IA aide les traders à dépasser ces limites en transformant la façon dont les marchés sont analysés, comment le sentiment est interprété et comment les risques sont contrôlés. Cet article explore comment l'IA remodèle le trading de crypto – et ce que cela signifie pour les traders aujourd'hui.
WEEX × LALIGA : Sept étoiles qui représentent une norme d’excellence commune
La véritable excellence dans le football n'est jamais accidentelle. Il repose sur la discipline, la constance et la capacité à livrer sous la pression – saison après saison. Les mêmes principes s'appliquent dans le trading professionnel, où les performances à long terme comptent plus que le momentum de courte durée. En tant que partenaire régional officiel de LALIGA, WEEX met en avant sept joueurs exceptionnels qui incarnent l'esprit de compétition et l'attrait mondial de la ligue. Chacun apporte un style unique au terrain, mais tous partagent des valeurs qui s'alignent étroitement sur l'engagement de WEEX en matière de stabilité, de précision et d'exécution professionnelle. Ce partenariat repose sur des normes communes — où la cohérence et le contrôle définissent la performance sous la pression.
De Wuhan à la Silicon Valley, Manus l'a fait en seulement neuf mois.
Vous pouvez l'appeler un « wrapper », mais il s'est emballé jusqu'à Meta.
WEEX s'associe à LALIGA pour étendre sa portée mondiale et intégrer la crypto dans la culture sportive dominante
Hong Kong, le 1er janvier 2026. WEEX a conclu un nouveau partenariat avec LALIGA, en tant que partenaire régional officiel de LALIGA à Taïwan et à Hong Kong. L'accord amène WEEX dans le réseau de collaborateurs régionaux de LALIGA et ouvre la porte à de nouvelles façons d'engager les fans et les traders pendant la saison.
Trading crypto IA : Comment les traders appliquent réellement l'IA sur les marchés crypto réels
L'intelligence artificielle a dépassé le stade de l'expérimentation sur les marchés crypto. En 2025, les outils de trading basés sur l'IA sont de plus en plus utilisés par les traders qui souhaitent une meilleure discipline, une exécution plus rapide et une prise de décision plus structurée sur des marchés volatils. Ce guide explique comment l'IA est réellement utilisée dans le trading de crypto, étape par étape, en mettant l'accent sur la façon dont ces stratégies sont exécutées dans des environnements de trading réels.
Mise à jour du marché — 31 décembre
De la Corée du Sud et de l'OCDE à l'accélération de la mise en œuvre des cadres de réglementation et de conformité crypto, en passant par le développement simultané des ETF TAO, des technologies de confidentialité, du minage et des réserves de bitcoins, alors que les incidents de sécurité et les pertes financières continuent d'augmenter, le marché crypto est entré dans une nouvelle phase au milieu de multiples défis de « réglementation forte + évolution technologique + risques amplifiés ».