
Bearish Candlestick Patterns

 Prefer us on Google
In our previous article "How to Read the Most Popular Candlestick Patterns," we introduced common candlestick formations that signal potential upward price movements. Conversely, bearish candlestick patterns emerge after an uptrend and indicate a possible reversal from bullish to bearish momentum. When these patterns appear, traders should carefully assess them in the context of the broader market structure.
Common Bearish Candlestick Patterns
- Hanging Man Pattern
- Shooting Star Pattern
- Bearish Engulfing Pattern
- Evening Star Pattern
- Three Black Crows Pattern
Important Note: Unlike traditional financial markets, cryptocurrency candlestick charts display green for price increases and red for price decreases.
Hanging Man Pattern
Hanging Man Pattern is a bearish reversal signal that appears after an uptrend. It features a small body (either green or red) with a long lower wick that's at least twice the body length, and little to no upper wick. This pattern indicates that despite initial buying pressure, sellers stepped in aggressively to push prices down before a slight recovery.

Source: Forexopher
Shooting Star Pattern
Shooting Star Pattern is a bearish reversal candlestick that forms after an uptrend, signaling potential trend exhaustion. It features a small real body (either bullish or bearish) positioned near the candle's low, with a long upper wick that's typically 2-3 times the body length and minimal lower wick. This distinctive shape reflects strong selling pressure that rejected higher prices after an attempted rally.

Source: FXOpen
Bearish Engulfing Pattern
Bearish Engulfing Pattern is a powerful two-candle reversal formation that emerges at potential market tops. This pattern begins with a small bullish candle, immediately followed by a larger bearish candle that completely engulfs the previous candle's body. The dramatic shift from buying to selling pressure suggests strong bearish momentum taking control, with the size of the engulfing candle directly correlating to the potential strength of the coming downtrend

Source: FXOpen
Evening Star Pattern
Evening Star Pattern is a highly reliable three-candle bearish reversal formation that emerges during uptrends, signaling potential trend exhaustion. This classic pattern begins with a strong bullish candle, followed by a small-bodied candle (which may be bullish, bearish or a doji) that gaps above the first candle, and concludes with a decisive bearish candle that closes below the midpoint of the initial bullish candle. The pattern's effectiveness increases when the third candle's close penetrates the first candle's low, demonstrating strong selling momentum.
Particularly noteworthy in cryptocurrency trading, this pattern maintains its predictive power despite the market's inverted color scheme (green for price increases, red for decreases), serving as a critical warning for traders to consider taking profits or implementing protective measures.
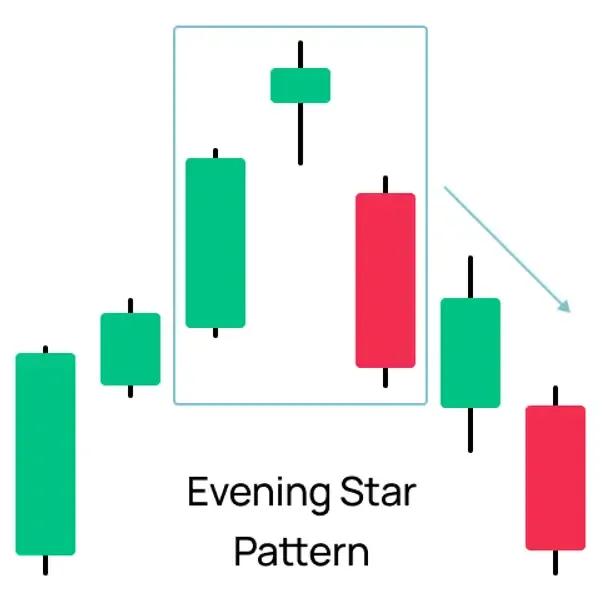
Source: Morpher
Three Black Crows Pattern
Three Black Crows Pattern is a potent bearish reversal signal characterized by three consecutive long-bodied red candles with minimal wicks, forming after an uptrend or at key resistance levels. Each candle opens near the previous close but faces increasing selling pressure that drives prices progressively lower, creating a staircase-like decline. This pattern demonstrates strong and consistent bearish momentum, with its reliability increasing when the candles show successively lower closes and minimal retracements.

Source: FXOpen
Disclaimer: This information does not provide advice on investment, taxation, legal, financial, accounting, or any other related services, nor does it constitute advice to purchase, sell, or hold any assets. WEEX Learn provides information for reference purposes only and does not constitute investment advice. Please ensure you fully understand the risks involved and exercise caution when investing. The platform is not responsible for users' investment decisions.
This content is provided for general informational purposes only and doesn't constitute financial, investment, legal, or tax advice. Any events, rewards, online promotions, or related information mentioned herein should not be considered a recommendation, solicitation, or invitation to purchase, sell, trade, or otherwise deal in any crypto assets. Crypto assets are highly volatile and may result in loss. The availability of WEEX services, products, and related events may vary by region. You are responsible for ensuring that your participation is in accordance with applicable local laws and regulations.
You may also like

UNI Futures: How to Set Take-Profit and Stop-Loss After a 2x Run

QNT Futures: Funding Rate and Long vs Short After a 4x Rally

BlackRock and Ondo's Tokenized Portfolios vs Traditional ETFs: What Actually Changes

WEEX Strategy Trading: 4 Ways to Automate Your Crypto Trades

WEEX Grid Trading: When a Grid Strategy Works and When It Fails

Ethereum Futures Trading: How to Size ETH Positions and Read PnL

SUI Futures Trading: How to Play the Breakout Without Liquidation

Bitcoin Short Squeeze Explained: Inside the $648M Sept 21 Wipeout

INJ Meridian Upgrade: What Activates Sept 24 and What to Watch

Why Is PEPE Up Today? The Meme Coin Liquidity Signal Explained

Crypto Leverage Trading: What 400x Leverage Actually Costs You

Funding Rate Crypto: What BTC and ETH Are Paying Right Now

Crypto Liquidation: The Exact Price That Wipes Out Your Position

XPL Unlock on Sept 25: How to Long or Short Plasma Futures Safely

NEAR Futures Take-Profit and Stop-Loss: Managing a Parabolic Move

ARB Futures After a 60% Week: Leverage, Isolated Margin and PnL

Bitcoin Funding Rate After a $648M Short Squeeze: What Longs Pay

Stop Loss in Crypto Futures: How to Set TP/SL That Survives Wicks

Bitcoin Futures After the Fed Hike: How to Trade BTC Above $80K

NEAR Price Jumps 80% in a Week: What Confidential Intents Changed

NVDA Perpetual Futures: Trading Nvidia 24/7 After the Fed Hike

ZEC Futures Trading: Leverage Lessons From Zcash's $1,400 Squeeze

Micron Earnings Sept. 30: Order Types and TP/SL on MU Perpetuals

Lumentum (LITE) Perpetual Futures: Why 25x Leverage Is the Limit

Lighter (LIT) Futures: Cross vs Isolated Margin on a 17% Range

SOL Perpetual Contracts: Mark Price, Index Price and Liquidation

XRP Futures: How to Long or Short XRP After the Clarity Act Vote

How to Test a Trading Strategy on WEEX Demo Before Going Live

WEEX API Key Security: What a Leaked Key Can Still Do to You

CoinEx Is Closing: Shutdown Timeline and How to Withdraw Before September 29, 2026
UNI Futures: How to Set Take-Profit and Stop-Loss After a 2x Run
QNT Futures: Funding Rate and Long vs Short After a 4x Rally
BlackRock and Ondo's Tokenized Portfolios vs Traditional ETFs: What Actually Changes
WEEX Strategy Trading: 4 Ways to Automate Your Crypto Trades
WEEX Grid Trading: When a Grid Strategy Works and When It Fails
Ethereum Futures Trading: How to Size ETH Positions and Read PnL
Contents
Popular coins
Latest articles


