- Buy Crypto
- Markets
 Futures
- Spot
- Copy Trade
- Earn
- More
What Are the Bollinger Bands?
What are the Bollinger Bands?
John Bollinger, a financial analyst and trader, conceived the Bollinger Bands (BB) in the early 1980s, and they have since become a fundamental instrument in technical analysis. Functioning as an oscillator, these bands provide insights into the market’s volatility, indicating whether it’s experiencing high or low levels, and signaling potential overbought or oversold scenarios.
The fundamental principle behind the BB indicator is to visualize how prices disperse around an average. Specifically, it consists of three components: an upper band, a lower band, and a central moving average line (also referred to as the middle band). The two outer bands are reactive to market price action, expanding to reflect increased volatility (diverging from the middle line) and contracting as volatility diminishes (converging towards the middle line).
The standard Bollinger Bands formula sets the middle line as a 20-day simple moving average (SMA), while the upper and lower bands are calculated based on the market volatility in relation to the SMA (which is referred to as standard deviation). The standard settings for the Bollinger Bands indicator would look like this:
- Middle line: 20-day simple moving average (SMA)
- Upper band: 20-day SMA + (20-day standard deviation x2)
- Lower band: 20-day SMA - (20-day standard deviation x2)
The default Bollinger Bands setting utilizes a 20-day period with the upper and lower bands positioned two standard deviations (x2) from the middle line. This configuration is designed to encompass at least 85% of price data, though settings are adjustable based on specific trading needs and strategies.
How to use Bollinger Bands in trading?
While widely applied in traditional finance, Bollinger Bands (BB) are also valuable in cryptocurrency trading. It’s crucial to understand that BB should not be used in isolation or as a sole buy/sell signal, but rather in conjunction with other technical analysis indicators. Interpreting BB data can involve observing price interaction with the bands: if the price moves above the middle average and beyond the upper band, it suggests an overbought condition, or if it repeatedly touches the upper band, it may signal strong resistance. Conversely, if the price drops significantly to or repeatedly touches the lower band, it indicates an oversold market or a strong support level. This allows traders, when combined with other TA, to define entry/exit points or simply track past overbought/oversold occurrences.
Beyond price-band interaction, the expansion and contraction of the Bollinger Bands themselves offer insights into market volatility. Bands moving apart (expansion) signify increasing volatility, while bands drawing closer (contraction or squeeze) indicate decreasing volatility. This dynamic makes BB particularly suited for short-term trading, aiding in the analysis of market volatility and potential future price movements. Traders often speculate that over-expanded bands might presage a consolidation period or a trend reversal, while excessively tight bands suggest an impending sharp price move.
In sideways markets, the BB typically narrows towards the central simple moving average. A common observation, though not universal, is that periods of low volatility and tight band deviation often precede significant, explosive price movements once volatility resurges. This phenomenon forms the basis of the “Bollinger Bands Squeeze” strategy.
The Bollinger Bands Squeeze strategy specifically identifies these low-volatility zones marked by band contraction. However, this strategy is neutral regarding market direction. Therefore, traders employing the Squeeze typically integrate it with other technical analysis tools, such as support and resistance lines, to gain clearer directional insights.
Conclusion
In essence, Bollinger Bands measure volatility and identify overbought/oversold conditions through dynamic upper/lower bands around a moving average. Effective for short-term trading, they signal potential reversals and breakouts via expansion/contraction. However, BBs work best when combined with other indicators for more reliable trading decisions.
You may also like

Conflict Escalates, Oil Prices Moon: How Will Crypto React?
History tells us that geopolitical shocks are often shown as a case of "short-term pain for long-term gain."
Trade here:
CRUDEOIL: Brent Crude (Tokenized)USOON: US Oil (Ondo/Tokenized)XAUT: Tether Gold(Tokenized)The Chaos of the Last Few Days
On February 28, the U.S. and Israel launched a joint military operation codenamed "Epic Fury." A massive airstrike on Iran wiped out core leadership, including Supreme Leader Khamenei. Iran retaliated instantly, moving to choke off the Strait of Hormuz.
There is no secret that the Strait of Hormuz is the world’s most important oil artery, carrying about 20% of global supply. In the world of energy, when the Strait closes, prices go parabolic.
Within just one week: Brent Crude jumped 28% to $92.69; WTI crude skyrocketed 36% to $90.90, marking its biggest weekly gain since 1983.
By March 9, the situation went from bad to worse. A drone strike took out Saudi Arabia's largest refinery, Kuwait slashed production, and Iraq’s daily output dropped by 1.5 million barrels. Oil smashed through the $100 barrier. Iran even upped the ante, warning that if Trump isn't reined in, oil could hit a record-breaking $200.
On March 10, Trump declared that the war was "basically over". Coupled with the G7’s plan to tap into strategic oil reserves and hints from the IRGC about reopening the Strait, these glimmers of hope helped stock markets claw back some losses. Oil began to cool off, with Brent crude retreating to the $85 mark.
By March 11, the time of writing, the International Energy Agency (IEA) proposed the largest emergency oil release in its history, sending Brent crude further down toward $80 per barrel.
The key takeaway: Last week’s "decapitation strike" did not actually rattle oil prices that much. What really sent the market into a tailspin was the realization that Trump’s "quick fix" rhetoric was spinning out of control. That’s when the panic-buying truly began.
Crypto Markets: Dip, Bounce, Dip Again
When the conflict first broke out over the weekend, Bitcoin did what it always does in a crisis — panicked first, recovered second. The whipsaw has been covered in detail in "US-Iran Tensions Boil Over: How War Rewires the Crypto Market".
Then came the plot twist. Instead of winding down after the targeted strikes, the Middle East conflict escalated further, forcing Trump to admit the military operation would drag on for 4 to 5 weeks. Markets took one look at that headline and sold off again.
This "dip to bounce to dip" pattern is practically a playbook at this point. Every major geopolitical shock runs the same script.
Here is a cruel truth regarding Bitcoin: it would not be trade like gold. It trades like a leveraged bet on dollar liquidity.
The "digital gold" narrative has stuck around for years, but when real chaos hits, Bitcoin's first instinct is pure risk-off panic, instead of safety. This also happened on March 12, 2020, with COVID fear wiping out 50% in a day, and on August 5, 2024 while the JPY carrying trade unwinds, Bitcoin cratered alongside the Nasdaq.
Same story this time. On February 28th, as the conflict erupted, Bitcoin flash-crashed toward $63,000. Weekend + war headlines = no liquidity with maximum fear.
The short-term read: War is noisy. Between Trump's contradictory statements, shifting military objectives, and oil supply headlines dropping every few hours, calling the next move is mostly a coin flip. What is predictable: volatility stays elevated. Buckle up.
On the macro side, the market currently anticipates a 97.4% probability that the Federal Reserve will maintain interest rates unchanged in March, with the timing of the first rate cut in 2026 now delayed from the initial expectation of March to the latter half of the year. High oil would lead to sticky inflation, causing the Fed to hold the rate remain. That is a tough environment for Bitcoin as well as other cryptos.
Opportunity in Crisis
While many observers are focusing on painting a doomsday scenario, yet the clues noted are less gloomy..
The first note would be Bitcoin’s drawdown, which is holding up much better than most would have expected.
The relevant observations have already been detailed in WEEX's previous article, US-Iran Tensions Boil Over: How War Rewires the Crypto Market, without further elaboration.
Second, how will the market price change once the dust settles?
History shows that while Bitcoin’s gut reaction to geopolitical shocks is usually a wave of forced liquidations, its long-term trajectory almost always runs counter to that initial panic. In a nutshell, the "dump-then-pump" logic remains undefeated.
Third, what if the war continues?
If the conflict in the Middle East becomes a prolonged affair, the focus will shift to the duration and intensity of the hostilities, as well as the actual recovery of shipping through the Strait of Hormuz. Crucially, if the global economy takes a significant hit, it would pave the way for the Fed to pivot toward more dovish monetary policies—which, ironically, would be a massive tailwind for Bitcoin.
This is the "counter-intuitive" bull case that Arthur Hayes recently highlighted. It is a complex domino effect with plenty of "if", but history proves that it has been a path the market traveled before.
The Future of On-Chain Narratives
Every upheaval in the established order presents a prime opportunity for decentralised assets to demonstrate their worth.
Interestingly, the biggest winner of this conflict is not Bitcoin, but stablecoins and RWA (Real World Assets).
During wartime, straits are alternately blockaded and opened. Nations impose price controls or deliberate on releasing oil reserves. Ordinary citizens bought gold and crude oil, or began transferring assets.
This is where stablecoins and on-chain protocols prove their worth. Their value is simple but profound: Permissionless, Trustless, Borderless, and 24/7.
Ultimately, this Middle East conflict has emphasised the dual nature of crypto. Bitcoin remains a high-beta play that swings with global liquidity. However, stablecoins and RWAs have proven themselves to be the Pragmatic Tools of Decentralization in times of chaos.
At this stage, "cautious optimism" beats "blind pessimism". After all, markets eventually stop pricing in the fear itself and start pricing in the recovery.

What is the Funding Rate and Why Funding Rate Matters?
If you've traded perpetual futures on WEEX, you've encountered the funding rate—a recurring fee between long and short traders. It keeps the contract price aligned with the spot market.
When the rate is positive, longs pay shorts. When negative, shorts pay longs. This mechanism prevents price drift and balances market sentiment.
Understanding funding rates helps you manage costs, gauge market mood, and trade smarter—whether on WEEX or elsewhere.
How Does the Funding Rate Work?Understanding how funding rate works is essential for anyone trading perpetual futures. In perpetual contracts, the contract price often deviates from the spot price. When this happens, the funding rate mechanism kicks in to restore balance.
Positive Funding RateWhen the contract price is higher than the spot price, the funding rate is positive. In this scenario:
Long position holders pay a funding fee to short position holdersThis incentivizes traders to take short positions or close longsThe selling pressure pushes the contract price closer to the spot priceNegative Funding RateWhen the contract price is lower than the spot price, the funding rate is negative. Here's what happens:
Short position holders pay the funding fee to long position holdersThis encourages buying activity and short coveringThe buying pressure pulls the contract price back up toward the spot priceThis fee mechanism keeps perpetual contract prices aligned with the actual market price, preventing the kind of wild divergences that could make futures trading purely speculative.
How to Check the Funding Rate on WEEX ExchangeIf you're trading on WEEX, checking the current funding rate is straightforward. The perpetual contract interface shows:
The current funding rate value for each trading pairA countdown timer to the next funding rate settlementHistorical funding rate data for analysisTo find detailed records of funding rates you've paid or received:
Navigate to [Assets] in your WEEX accountSelect Contract [Bill]Look for "Funds cost" or funding rate entriesThis transparency helps you track exactly how much the funding rate is impacting your trading P&L.
How Does the Funding Rate Impact Trading Strategies?The funding rate directly affects trading costs and can significantly influence your strategy, especially for positions held over multiple settlement periods.
For Long TradersIf the funding rate stays positive over extended periods:
Long traders face higher holding costsConsider reducing leverage or shortening holding timeHigh positive rates can signal overheated bullish sentimentFor Short TradersIf the funding rate stays negative:
Short traders pay fees to longsPersistent negative rates may indicate strong bearish pressureFactor these costs into your risk calculationsWhy Funding Rates Matter for TradersThe significance of what funding rate is goes beyond just a tiny transaction fee. These rates play a pivotal role in the crypto trading ecosystem.
Price ParityFunding rates ensure that perpetual futures prices stay aligned with spot prices, preventing wild discrepancies that could distort the market.
Market Sentiment IndicatorA consistently positive funding rate often signals bullish sentiment, with more traders betting on rising prices. A negative rate might hint at bearish outlooks. Monitoring these rates gives you insight into crowd psychology.
Cost ManagementFor positions held across multiple settlement periods, funding rates can significantly impact profitability. Understanding them helps you decide when to enter, adjust, or exit positions based on both cost and market conditions.
Incentive MechanismWhen prices drift apart, higher funding rates encourage traders to take positions that help restore equilibrium. It's the market's way of self-correcting.
How to Use Funding Rates in Your Trading StrategyLet's talk practical strategy. Knowing what funding rate is and how it behaves can directly influence your trading decisions.
Monitor Funding Rate TrendsBefore entering a position, check the current funding rate and its recent history. Extremely high rates often precede reversals as traders adjust to avoid costs.
Time Your Entries and ExitsConsider timing your trades around funding settlement periods. Entering a short position just before a high positive rate payment could earn you fees rather than paying them.
Final ThoughtsUnderstanding funding rates isn't just technical knowledge—it's a practical tool for smarter trading. Whether on WEEX or elsewhere, funding rates directly impact your P&L, especially for positions held across multiple settlements.
Monitoring them gives you insight into market sentiment, helps manage costs, and can even reveal arbitrage opportunities. Extreme rates often signal crowded trades and potential reversals, giving you an edge in timing entries and exits.
They're neither good nor bad—just a mechanism that keeps futures markets functioning. The key is understanding them and factoring them into your decisions.
Ready to put this knowledge into practice? WEEX offers transparent funding rate displays, user-friendly futures trading, and a 20 USDT welcome bonus for new users. Register on WEEX Now and Start Trading Futures
FAQQ1: What is funding rate in crypto futures?A: The funding rate is a periodic fee exchanged between long and short traders in perpetual futures markets. It keeps the contract price aligned with the spot price.
Q2: How is the funding rate calculated?A: The funding rate is based on two components: the interest rate (a small stable percentage) and the premium index (which measures price deviation between futures and spot).
Q3: When is funding rate charged on WEEX?A: On WEEX, funding is settled at 00:00, 08:00, and 16:00 UTC (07:00, 15:00, 23:00 UTC+8).
Q4: Do I pay funding rate if I hold a position for less than 8 hours?A: If you close your position before a settlement time, you won't pay or receive funding for that period. Funding only applies to positions held through settlement.

Cold Wallet 2026: What Is a Crypto Cold Wallet and How Does It Work?
The rapid growth of cryptocurrency adoption has made secure storage a major concern for investors in 2026. With high-profile exchange failures and increasingly sophisticated hacking attempts, protecting digital assets has never been more critical. Many users now move part of their assets into cold wallets to reduce the risk of hacks and exchange failures.
Understanding how cold wallets work is essential before deciding whether to store crypto offline. This guide covers everything you need to know about crypto cold wallets, from basic concepts to practical security considerations.
What Is a Cold Wallet for Crypto?A cold wallet is a cryptocurrency storage method where private keys are kept offline instead of on an internet-connected device. Private keys are the credentials that prove ownership of digital assets such as Bitcoin, Ethereum, or other tokens. Because they remain disconnected from the internet, cold wallets significantly reduce exposure to hacking attempts.
In practice, a cold wallet isolates sensitive information from online systems. Even if a user's computer becomes infected with malware, the private keys stored offline cannot be accessed remotely. For this reason, long-term investors, institutions, and crypto funds frequently use cold storage to protect large holdings.
The fundamental principle is simple: if your private keys never touch the internet, they cannot be stolen through online attacks. This makes cold wallets the gold standard for securing cryptocurrency.
How Does a Crypto Cold Wallet Work?Understanding how a cold wallet works is crucial for anyone serious about crypto security. A cold wallet generates and stores private keys in an environment that is not connected to the internet. When a user wants to send cryptocurrency, a transaction is created on an online device but signed on the offline device holding the keys.
The simplified process usually looks like this:
A transaction is prepared on an online device (like a computer or phone)The unsigned transaction is transferred to the cold wallet (via USB, QR code, or manual entry)The cold wallet signs the transaction using the private key stored offlineThe signed transaction is returned to an online device and broadcast to the blockchainBecause the signing step occurs offline, attackers cannot steal the private keys through the internet. This air-gapped approach ensures that even if your online device is compromised, your funds remain secure.
Types of Crypto Cold WalletsThere are several forms of cold wallets available today. Each offers different levels of convenience and security, allowing users to choose based on their specific needs and technical comfort.
Hardware WalletsHardware wallets are physical devices built specifically to protect crypto private keys. They are the most popular type of cold wallet for individual investors in 2026. These devices typically connect through USB or use QR codes and include built-in screens that allow users to verify transactions securely.
Many modern devices also include secure chips, PIN codes, and recovery seed phrases. These features protect assets even if the wallet device is lost or stolen. Leading examples include Ledger and Trezor, which have become household names in the crypto security space.
Hardware wallets strike an excellent balance between security and usability, making them the recommended choice for most long-term holders.
Offline Software WalletsOffline software wallets operate on computers that are permanently disconnected from the internet. This setup is sometimes called an air-gapped wallet. A dedicated laptop or computer is used exclusively for generating and signing transactions, with no network connectivity.
While secure, this approach requires more technical knowledge and careful operational procedures. It is usually preferred by advanced users or institutions with significant technical resources.
Paper WalletsA paper wallet is simply a printed private key or QR code stored physically. It was one of the earliest forms of cold storage and remains conceptually simple. Users generate a key pair on an offline computer, print the keys, and store the paper securely.
However, paper wallets are now considered risky because they can easily be destroyed, stolen, or misplaced. Many modern security guides discourage their use in favor of more robust solutions like hardware wallets.
Metal WalletsMetal wallets store seed phrases engraved on durable metal plates. These are primarily used as backups rather than active wallets. They are resistant to fire, water damage, and physical wear, which makes them useful for long-term recovery storage.
A metal wallet doesn't store your crypto directly but protects the recovery phrase needed to restore your funds if your primary wallet is lost or damaged.
Sound WalletsSound wallets encode private keys as audio files stored on physical media such as USB drives or discs. While innovative, they are rarely used in practice and require specialized tools to decode. This approach remains largely experimental.
Should I Put My Crypto Assets in a Cold Wallet?Whether to use a cold wallet depends largely on how you manage your cryptocurrency. Investors who hold assets long term often store a large percentage of their holdings offline.
Cold wallets are especially useful when:
Holding large amounts of crypto—the more you have, the more you stand to lose in a hackStoring assets for months or years—long-term holdings don't need frequent accessProtecting funds from exchange risks—cold storage eliminates counterparty riskHowever, traders who move assets frequently may still rely on hot wallets for convenience. A common strategy is to keep small trading balances in hot wallets while storing the majority of long-term holdings in cold storage.
Is a Cold Wallet 100% Safe?Cold wallets are among the safest crypto storage methods, but they are not completely risk-free. Their main advantage is protection from online attacks, which are the most common form of crypto theft. When implemented correctly, cold storage makes remote hacking virtually impossible.
However, offline storage introduces other risks that users must understand:
Losing the recovery phrase—if your seed phrase is lost, your funds are gone foreverPhysical damage—fire, water, or simple wear can destroy a hardware walletTheft—if someone steals your wallet and knows your PIN, funds could be at riskHuman error—mistakes in transaction signing or backup procedures can lead to lossSecurity experts generally recommend a layered approach. Many investors keep smaller trading balances in hot wallets while storing long-term holdings in cold storage. This strategy provides both convenience and security.
Cold Wallet vs Hot WalletUnderstanding the difference between hot wallets and cold wallets is key to smart crypto storage.
Hot wallets stay connected to the internet—think exchange accounts, MetaMask, or mobile apps. They're convenient for daily trades but vulnerable to online attacks.
Cold wallets stay offline. They're less convenient but offer far stronger protection against hackers.
That's why many investors split their funds: keep 5–10% in hot wallets for trading, and store the other 90–95% in cold storage for long-term security. Best of both worlds.
Read More: Hot Wallet vs. Cold Wallet: Which is Better for You?
Final Thoughts: Securing Your Crypto with Cold WalletsAs crypto adoption grows in 2026, so do online risks. Cold wallets offer the strongest protection for serious investors—keeping private keys offline is the core principle.
Yes, they require more care than hot wallets, but the security benefits far outweigh the inconvenience. For long-term holders and significant balances, cold storage isn't just recommended—it's essential.
Ready to start securing your crypto? WEEX offers a secure platform for buying and trading, but remember—for long-term storage, consider moving your assets to a cold wallet. Register on WEEX Now and Start Trading!
FAQQ1: What is a cold wallet in crypto?A: A cold wallet is a cryptocurrency wallet that stores private keys offline, protecting funds from online hacks and malware. It's the most secure way to store crypto for long periods.
Q2: How does a cold wallet work?A: A cold wallet generates and stores private keys offline. Transactions are created online but signed on the offline device, then broadcast to the network. The private keys never touch the internet.
Q3: Is a cold wallet safer than a hot wallet?A: Yes, cold wallets are generally safer because they remain disconnected from the internet, reducing exposure to cyberattacks. Hot wallets offer more convenience but greater risk.
Q4: Do I need a cold wallet for crypto?A: If you hold large amounts of cryptocurrency or plan long-term storage, using a cold wallet can significantly improve security. Small amounts held for trading may be fine in hot wallets.
Buy ETH with OVO on WEEX P2P – 0 Fee & Ultra-Fast IDR Trades
OVO is a top-choice option in Indonesia, offering users a fast and reliable way to buy ETH using IDR. With WEEX P2P, users can buy ETH directly through OVO with zero fees, access 24/7 verified merchants, and enjoy ultra-fast release times.
Compared with Binance, Bybit, and local OTC platforms, WEEX consistently offers better IDR exchange rates, safer escrow protection, and more available ads for OVO users.
With ETH adoption rising across Indonesia, reliable and fast access to digital assets has turned into a key requirement for users. With WEEX P2P, users can buy USDT, BTC, or ETH via OVO with instant processing, 0% buyer fees, and professional merchant support.
What is P2P Trading?
Peer-to-Peer (P2P) trading allows users to buy and sell ETH directly with other users, while the platform acts as a secure intermediary.
On WEEX P2P:
ETH is held in escrowSellers release assets only after payment is confirmedTrades are processed quickly and safelyThis ensures zero counterparty risk and allows users to pay via local banking methods for a seamless experience.
Why WEEX P2P is the Best Choice for OVO Users
WEEX P2P offers key advantages to users purchasing ETH with IDR via OVO:
0% fee for buyers (save 2-8% vs competitors)Fast release times (1–3 minutes on average)Official escrow protection – 100% safeSupport from small amounts to large-volume tradesBest IDR exchange rates for OVO usersThousands of merchants online 24/7More OVO ads than any competing platformWhether you’re buying 1,000 IDR or 1,000,000 IDR, WEEX ensures fast, safe, and cost-efficient ETH purchases.
How to Buy ETH with OVO on WEEX P2P
Buying ETH with OVO on WEEX is simple and fast. Follow these steps:
Register on WEEX and complete basic KYC Takes less than 1 minute.Go to Buy ETH → P2P Trading Select IDR as your fiat currency.Filter by “OVO” You will now only see advertisements that support OVO transfers.Select the best merchant Compare based on:PriceCompletion rateVolumeOnline statusEnter the amount you want to buy The system will show your exact cost in IDR.Make the payment via OVO Transfer the amount shown using the merchant’s bank details.Tap “Transferred, Notify Seller” The seller will verify your payment and release ETH.Your ETHC will arrive instantly in your WEEX wallet — safe, fast, and with zero fees.
Frequently Asked Questions (FAQ)
Q1: Are there any fees when paying with OVO? A: 0% fee for buyers. Only sellers pay a small fee.
Q2: How fast will I receive ETH? A: Usually 1–5 minutes after marking payment as sent.
Q3: Is buying with OVO safe on WEEX? A: Yes. All trades use official escrow.
Q4: Do I need full KYC? A: Basic KYC is required for P2P trading.
Ready to Buy ETHC with OVO?
Start buying ETH in under 3 minutes — fast, safe, and 0% fee for buyers!
Start Buying ETH on WEEX P2P with OVO Now!
Buy USDC with OVO on WEEX P2P – 0 Fee & Ultra-Fast IDR Trades
OVO is a top-choice option in Indonesia, offering users a fast and reliable way to buy USDC using IDR. With WEEX P2P, users can buy USDC directly through OVO with zero fees, access 24/7 verified merchants, and enjoy ultra-fast release times.
Compared with Binance, Bybit, and local OTC platforms, WEEX consistently offers better IDR exchange rates, safer escrow protection, and more available ads for OVO users.
With USDC adoption rising across Indonesia, reliable and fast access to digital assets has turned into a key requirement for users. With WEEX P2P, users can buy USDT, BTC, or ETH via OVO with instant processing, 0% buyer fees, and professional merchant support.
What is P2P Trading?
Peer-to-Peer (P2P) trading allows users to buy and sell USDC directly with other users, while the platform acts as a secure intermediary.
On WEEX P2P:
USDC is held in escrowSellers release assets only after payment is confirmedTrades are processed quickly and safelyThis ensures zero counterparty risk and allows users to pay via local banking methods for a seamless experience.
Why WEEX P2P is the Best Choice for OVO Users
WEEX P2P offers key advantages to users purchasing USDC with IDR via OVO:
0% fee for buyers (save 2-8% vs competitors)Fast release times (1–3 minutes on average)Official escrow protection – 100% safeSupport from small amounts to large-volume tradesBest IDR exchange rates for OVO usersThousands of merchants online 24/7More OVO ads than any competing platformWhether you’re buying 1,000 IDR or 1,000,000 IDR, WEEX ensures fast, safe, and cost-efficient USDC purchases.
How to Buy USDC with OVO on WEEX P2P
Buying USDC with OVO on WEEX is simple and fast. Follow these steps:
Register on WEEX and complete basic KYC Takes less than 1 minute.Go to Buy USDC → P2P Trading Select IDR as your fiat currency.Filter by “OVO” You will now only see advertisements that support OVO transfers.Select the best merchant Compare based on:PriceCompletion rateVolumeOnline statusEnter the amount you want to buy The system will show your exact cost in IDR.Make the payment via OVO Transfer the amount shown using the merchant’s bank details.Tap “Transferred, Notify Seller” The seller will verify your payment and release USDC.Your USDCC will arrive instantly in your WEEX wallet — safe, fast, and with zero fees.
Frequently Asked Questions (FAQ)
Q1: Are there any fees when paying with OVO? A: 0% fee for buyers. Only sellers pay a small fee.
Q2: How fast will I receive USDC? A: Usually 1–5 minutes after marking payment as sent.
Q3: Is buying with OVO safe on WEEX? A: Yes. All trades use official escrow.
Q4: Do I need full KYC? A: Basic KYC is required for P2P trading.
Ready to Buy USDCC with OVO?
Start buying USDC in under 3 minutes — fast, safe, and 0% fee for buyers!
Start Buying USDC on WEEX P2P with OVO Now!
Buy USDT with OVO on WEEX P2P – 0 Fee & Ultra-Fast IDR Trades
OVO is a top-choice option in Indonesia, offering users a fast and reliable way to buy crypto using IDR. With WEEX P2P, users can buy crypto directly through OVO with zero fees, access 24/7 verified merchants, and enjoy ultra-fast release times.
Compared with Binance, Bybit, and local OTC platforms, WEEX consistently offers better IDR exchange rates, safer escrow protection, and more available ads for OVO users.
With crypto adoption rising across Indonesia, reliable and fast access to digital assets has turned into a key requirement for users. With WEEX P2P, users can buy USDT, BTC, or ETH via OVO with instant processing, 0% buyer fees, and professional merchant support.
What is P2P Trading?
Peer-to-Peer (P2P) trading allows users to buy and sell crypto directly with other users, while the platform acts as a secure intermediary.
On WEEX P2P:
Crypto is held in escrowSellers release assets only after payment is confirmedTrades are processed quickly and safelyThis ensures zero counterparty risk and allows users to pay via local banking methods for a seamless experience.
Why WEEX P2P is the Best Choice for OVO Users
WEEX P2P offers key advantages to users purchasing crypto with IDR via OVO:
0% fee for buyers (save 2-8% vs competitors)Fast release times (1–3 minutes on average)Official escrow protection – 100% safeSupport from small amounts to large-volume tradesBest IDR exchange rates for OVO usersThousands of merchants online 24/7More OVO ads than any competing platformWhether you’re buying 1,000 IDR or 1,000,000 IDR, WEEX ensures fast, safe, and cost-efficient crypto purchases.
How to Buy Crypto with OVO on WEEX P2P
Buying crypto with OVO on WEEX is simple and fast. Follow these steps:
Register on WEEX and complete basic KYC Takes less than 1 minute.Go to Buy Crypto → P2P Trading Select IDR as your fiat currency.Filter by “OVO” You will now only see advertisements that support OVO transfers.Select the best merchant Compare based on:PriceCompletion rateVolumeOnline statusEnter the amount you want to buy The system will show your exact cost in IDR.Make the payment via OVO Transfer the amount shown using the merchant’s bank details.Tap “Transferred, Notify Seller” The seller will verify your payment and release crypto.Your Crypto will arrive instantly in your WEEX wallet — safe, fast, and with zero fees.
Frequently Asked Questions (FAQ)
Q1: Are there any fees when paying with OVO? A: 0% fee for buyers. Only sellers pay a small fee.
Q2: How fast will I receive Crypto? A: Usually 1–5 minutes after marking payment as sent.
Q3: Is buying with OVO safe on WEEX? A: Yes. All trades use official escrow.
Q4: Do I need full KYC? A: Basic KYC is required for P2P trading.
Ready to Buy Crypto with OVO?
Start buying crypto in under 3 minutes — fast, safe, and 0% fee for buyers!
Start Buying Crypto on WEEX P2P with OVO Now!
Buy BTC with OVO on WEEX P2P – 0 Fee & Ultra-Fast IDR Trades
OVO is a top-choice option in Indonesia, offering users a fast and reliable way to buy BTC using IDR. With WEEX P2P, users can buy BTC directly through OVO with zero fees, access 24/7 verified merchants, and enjoy ultra-fast release times.
Compared with Binance, Bybit, and local OTC platforms, WEEX consistently offers better IDR exchange rates, safer escrow protection, and more available ads for OVO users.
With BTC adoption rising across Indonesia, reliable and fast access to digital assets has turned into a key requirement for users. With WEEX P2P, users can buy USDT, BTC, or ETH via OVO with instant processing, 0% buyer fees, and professional merchant support.
What is P2P Trading?
Peer-to-Peer (P2P) trading allows users to buy and sell BTC directly with other users, while the platform acts as a secure intermediary.
On WEEX P2P:
BTC is held in escrowSellers release assets only after payment is confirmedTrades are processed quickly and safelyThis ensures zero counterparty risk and allows users to pay via local banking methods for a seamless experience.
Why WEEX P2P is the Best Choice for OVO Users
WEEX P2P offers key advantages to users purchasing BTC with IDR via OVO:
0% fee for buyers (save 2-8% vs competitors)Fast release times (1–3 minutes on average)Official escrow protection – 100% safeSupport from small amounts to large-volume tradesBest IDR exchange rates for OVO usersThousands of merchants online 24/7More OVO ads than any competing platformWhether you’re buying 1,000 IDR or 1,000,000 IDR, WEEX ensures fast, safe, and cost-efficient BTC purchases.
How to Buy BTC with OVO on WEEX P2P
Buying BTC with OVO on WEEX is simple and fast. Follow these steps:
Register on WEEX and complete basic KYC Takes less than 1 minute.Go to Buy BTC → P2P Trading Select IDR as your fiat currency.Filter by “OVO” You will now only see advertisements that support OVO transfers.Select the best merchant Compare based on:PriceCompletion rateVolumeOnline statusEnter the amount you want to buy The system will show your exact cost in IDR.Make the payment via OVO Transfer the amount shown using the merchant’s bank details.Tap “Transferred, Notify Seller” The seller will verify your payment and release BTC.Your BTC will arrive instantly in your WEEX wallet — safe, fast, and with zero fees.
Frequently Asked Questions (FAQ)
Q1: Are there any fees when paying with OVO? A: 0% fee for buyers. Only sellers pay a small fee.
Q2: How fast will I receive BTC? A: Usually 1–5 minutes after marking payment as sent.
Q3: Is buying with OVO safe on WEEX? A: Yes. All trades use official escrow.
Q4: Do I need full KYC? A: Basic KYC is required for P2P trading.
Ready to Buy BTC with OVO?
Start buying BTC in under 3 minutes — fast, safe, and 0% fee for buyers!
Start Buying BTC on WEEX P2P with OVO Now!
Buy Crypto with OVO on WEEX P2P – 0 Fee & Ultra-Fast IDR Trades
OVO is a top-choice option in Indonesia, offering users a fast and reliable way to buy crypto using IDR. With WEEX P2P, users can buy crypto directly through OVO with zero fees, access 24/7 verified merchants, and enjoy ultra-fast release times.
Compared with Binance, Bybit, and local OTC platforms, WEEX consistently offers better IDR exchange rates, safer escrow protection, and more available ads for OVO users.
With crypto adoption rising across Indonesia, reliable and fast access to digital assets has turned into a key requirement for users. With WEEX P2P, users can buy USDT, BTC, or ETH via OVO with instant processing, 0% buyer fees, and professional merchant support.
What is P2P Trading?
Peer-to-Peer (P2P) trading allows users to buy and sell crypto directly with other users, while the platform acts as a secure intermediary.
On WEEX P2P:
Crypto is held in escrowSellers release assets only after payment is confirmedTrades are processed quickly and safelyThis ensures zero counterparty risk and allows users to pay via local banking methods for a seamless experience.
Why WEEX P2P is the Best Choice for OVO Users
WEEX P2P offers key advantages to users purchasing crypto with IDR via OVO:
0% fee for buyers (save 2-8% vs competitors)Fast release times (1–3 minutes on average)Official escrow protection – 100% safeSupport from small amounts to large-volume tradesBest IDR exchange rates for OVO usersThousands of merchants online 24/7More OVO ads than any competing platformWhether you’re buying 1,000 IDR or 1,000,000 IDR, WEEX ensures fast, safe, and cost-efficient crypto purchases.
How to Buy Crypto with OVO on WEEX P2P
Buying crypto with OVO on WEEX is simple and fast. Follow these steps:
Register on WEEX and complete basic KYC Takes less than 1 minute.Go to Buy Crypto → P2P Trading Select IDR as your fiat currency.Filter by “OVO” You will now only see advertisements that support OVO transfers.Select the best merchant Compare based on:PriceCompletion rateVolumeOnline statusEnter the amount you want to buy The system will show your exact cost in IDR.Make the payment via OVO Transfer the amount shown using the merchant’s bank details.Tap “Transferred, Notify Seller” The seller will verify your payment and release crypto.Your Crypto will arrive instantly in your WEEX wallet — safe, fast, and with zero fees.
Frequently Asked Questions (FAQ)
Q1: Are there any fees when paying with OVO? A: 0% fee for buyers. Only sellers pay a small fee.
Q2: How fast will I receive Crypto? A: Usually 1–5 minutes after marking payment as sent.
Q3: Is buying with OVO safe on WEEX? A: Yes. All trades use official escrow.
Q4: Do I need full KYC? A: Basic KYC is required for P2P trading.
Ready to Buy Crypto with OVO?
Start buying crypto in under 3 minutes — fast, safe, and 0% fee for buyers!
Start Buying Crypto on WEEX P2P with OVO Now!
Spot vs Futures vs Margin Trading: Key Differences Every Crypto Beginner Should Know
For anyone entering the world of cryptocurrency, one of the first questions that appears is simple but confusing: what is the difference between spot trading, spot margin trading, and futures trading?
If you have ever opened a crypto exchange and seen buttons labeled Spot, Margin, or Futures, you probably wondered whether they are just different names for the same thing. In reality, they represent three very different ways of participating in the crypto market.
Understanding the difference between spot trading, spot margin trading, and futures trading is essential because each method changes how you manage risk, how much capital you need, and how you profit from market movements.
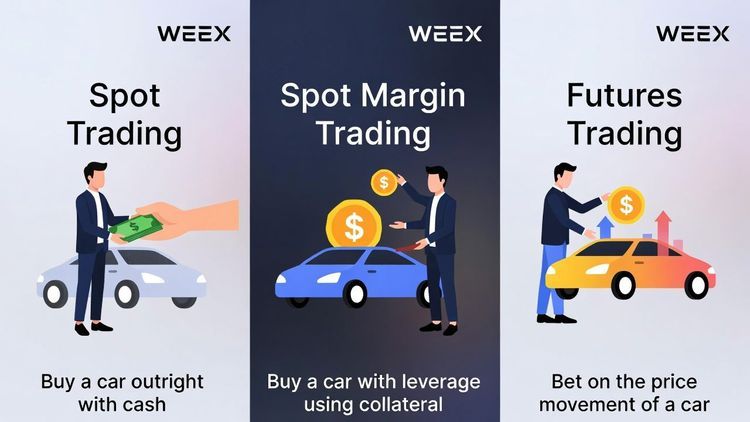
Think of it like transportation. Spot trading is like buying a car outright. Spot margin trading is like buying the car with a loan. Futures trading is more like making a bet on whether car prices will go up or down in the future.
Once you see the market through that lens, the structure becomes much easier to understand.
What Is Spot Trading? The Simplest Way to Buy and Sell CryptoSpot trading is the most straightforward way to buy and sell cryptocurrency. When you participate in spot trading, you purchase a cryptocurrency and own the asset immediately.
If you buy Bitcoin through spot trading, the Bitcoin goes directly into your wallet or exchange account. There are no loans, no leverage, and no expiration dates. What you own is real crypto that you can hold, transfer, or sell whenever you choose.
Because of this simplicity, spot trading is often compared to buying stocks or commodities. You exchange your funds for an asset at the current market price, also known as the spot price.
Imagine buying Bitcoin at $60,000 through spot trading. If the price later rises to $70,000, you can sell the Bitcoin and keep the profit. If the price falls, your asset value decreases, but you still own the Bitcoin itself.
This is why spot trading is widely considered the most beginner-friendly method in the crypto market. There is no borrowing, no liquidation risk, and no complex mechanics behind the trade.
Many newcomers start their journey through spot trading before exploring more advanced instruments.
What Is Spot Margin Trading? A Leveraged Way to Increase Buying PowerWhile spot trading requires you to use only the funds you already own, spot margin trading introduces borrowing.
In spot margin trading, traders can borrow funds from the platform in order to increase their buying power. This borrowed capital allows traders to open larger positions than their current balance would normally allow.
Imagine you have $100 but want to open a $500 trade. With spot margin trading, the platform can lend you the additional funds needed to complete the trade. This creates leverage, meaning your profits and losses become amplified.
If the market moves in your favor, spot margin trading can significantly increase your returns. However, if the market moves against you, the losses also grow faster.
The key difference between spot trading and spot margin trading lies in the use of borrowed funds. When borrowing is involved, the platform requires collateral and charges interest on the borrowed amount.
Because of this, spot margin trading introduces the possibility of liquidation. If the value of your collateral falls below a certain threshold, the system may automatically close your position to repay the borrowed funds.
Despite the additional risk, spot margin trading remains popular among traders who want greater exposure to market movements while still trading directly in the spot market.
What Is Futures Trading? How Traders Profit from Crypto Price MovementsWhile spot trading and spot margin trading involve actual cryptocurrency ownership, futures trading works differently. Instead of buying the asset itself, traders are speculating on the future price of that asset.
In futures trading, you are essentially entering a contract that reflects the price movement of a cryptocurrency such as Bitcoin or Ethereum. The trader does not necessarily own the underlying asset.
One of the biggest advantages of futures trading is the ability to profit whether the market rises or falls. Traders can open a long position if they believe prices will increase or a short position if they believe prices will decrease.
This makes futures trading especially attractive in volatile crypto markets where prices can move dramatically in both directions.
Another defining feature of futures trading is leverage. Futures platforms often allow traders to open positions worth many times their initial capital. For example, with 10× leverage, a $100 margin can control a $1,000 position.
However, leverage also increases risk. If the market moves against the trader, losses can accumulate quickly and may trigger liquidation.
Within futures trading, there are two main contract types: futures contracts with expiration dates and perpetual contracts without expiration.
Traditional futures contracts settle at a predetermined time, while perpetual contracts allow traders to keep positions open indefinitely.
Comparison Between Spot Trading, Spot Margin Trading, and Futures Trading
Spot Trading
Spot Margin Trading
Futures Trading
Futures Contracts
Perpetual Contracts
Market
Spot Market
Spot Market
Futures Market
Perpetual Market
Expiration Date
N/A
N/A
The expiration date ranges from daily to quarterly depending on the contract.
No expiration date, allowing positions to be held indefinitely.
Trading Fee
Spot trading fee
Spot trading fee, interest on borrowed funds, and repayment handling fees if auto-repayment is triggered
Futures trading fee and settlement fee
Perpetual trading fee and funding fee
Leverage
Leverage is not supported. To acquire assets worth 100 USDT, you must have 100 USDT.
Leverage allows traders to borrow funds. For example, with 10× leverage and 10 USDT, a trader can open a position worth 100 USDT.
Leverage allows positions to be opened with smaller capital. For example, a 100 USDT position with 10× leverage requires only 10 USDT as initial margin.
Same leverage mechanics as futures contracts, but without expiration constraints.
Maximum Leverage
N/A
Up to 10×
Typically 25× to 125× depending on the trading pair
Typically 25× to 125× depending on the trading pair
Borrowing
Not supported
Traders borrow funds from the platform and interest is charged hourly
Borrowing may apply depending on account structure
Borrowing conditions may apply depending on account structure
Collateral
Not required
Margin assets act as collateral
Initial margin acts as collateral for opening a position
Initial margin acts as collateral
Source of Profit
Profit comes from asset price appreciation
Profit comes from amplified price movements using borrowed funds
Traders can profit from both rising and falling markets
Traders can profit from both directions with no expiration constraint
Liquidation Risk
No
Yes
Yes
Yes
Which One Should Beginners Use?
For most newcomers entering the cryptocurrency market, spot trading is usually the safest and most intuitive place to start. Because spot trading does not involve borrowing or leverage, traders can focus on understanding price movements and market behavior without the additional pressure of liquidation risk.
After gaining experience with spot trading, some traders begin exploring spot margin trading to increase their exposure to market opportunities. This step requires careful risk management because borrowing introduces additional volatility.
More advanced traders often move toward futures trading, where leverage and the ability to short the market create more complex strategies.
Platforms like WEEX provide a comprehensive trading environment where users can move smoothly between spot trading, spot margin trading, and futures trading depending on their experience level. With professional-grade infrastructure, deep liquidity, and advanced risk-management tools, WEEX has become a trusted platform for both beginners and experienced crypto traders looking to explore different trading strategies in one unified ecosystem.
Final Thoughts: Understanding the Difference Between Spot, Margin, and FuturesThe difference between spot trading, spot margin trading, and futures trading ultimately comes down to ownership, leverage, and risk.
Spot trading focuses on direct ownership of cryptocurrency. Spot margin trading expands that exposure by introducing borrowed funds. Futures trading moves beyond ownership entirely, allowing traders to speculate on price direction through leveraged contracts.
Each method plays an important role in the modern crypto market. For beginners, starting with spot trading builds a strong foundation. As knowledge grows, spot margin trading and futures trading can offer additional flexibility and strategy options.
Understanding these differences not only improves trading decisions but also helps traders navigate the rapidly evolving cryptocurrency ecosystem with greater confidence.

How to Buy the Dip in Crypto: Best Proven Strategies for 2026
If you've spent any time in crypto, you've seen "BTD" —Buy the Dip. It's more than a catchphrase; it's a core crypto trading philosophy. Simply put, buying the dip means purchasing an asset after a temporary price drop.
Think of it like a store sale. A dip lets you buy at a discount, lowering your average cost and boosting potential profits when the market rebounds.
But here's the catch: crypto isn't a retail store. Not every drop is a "sale." A price fall could be a healthy correction or the start of a long-term crash. The golden rule? Not every drop is a dip—some are trend reversals. Successful traders know the difference.
Why Most Crypto Traders Fail to Buy the DipBuying the dip sounds easy in theory, but in practice, it's a psychological battle. When prices are crashing and your social media feed is filled with "doom and gloom," the natural human instinct is to protect what you have and sell—not buy more.
The most successful traders often follow the famous mantra: "Be fearful when others are greedy, and greedy when others are fearful." When a dip occurs, the market is driven by fear. This fear often causes "weak hands" to sell their assets at a loss. For a disciplined trader, this mass exit creates an opportunity.
However, if you haven't mastered your emotions, you might find yourself paralyzed by "analysis paralysis," waiting for the price to drop "just a little bit lower" until you miss the bounce entirely. This is where having a structured crypto trading plan becomes essential—it removes emotion from the equation and replaces it with strategy.
Top Technical Tools to Spot Your Entry When Buying the DipTo move from a casual trader to a strategic investor, you need to replace "gut feelings" with objective data. Several powerful technical analysis tools can help you pinpoint exactly when a dip has reached its bottom.
Best Trading Strategies for Buying Crypto DipsExecution is often where traders struggle most. Even with the right indicators, your entry method determines your risk-to-reward ratio. Here are three battle-tested strategies to remove emotion from your trading.
Strategy 1: The Ladder ApproachOne of the most common mistakes is trying to pick the "perfect" bottom. The Ladder Approach solves this by breaking your entry into multiple parts. Instead of going "all-in" at a single price, you place a series of buy limit orders at descending intervals.
For example, if Bitcoin is at $100,000, your ladder might look like:
Order 1: 20% of capital at a -5% dropOrder 2: 30% of capital at a -10% dropOrder 3: 50% of capital at a -15% dropBy layering your orders, you ensure that if the dip goes deeper than expected, your average entry price becomes lower. This significantly reduces the psychological stress of watching a price drop after your first buy.
Strategy 2: Automated DCA via Grid TradingIf you can't monitor charts 24/7, automated dollar-cost averaging (DCA) is your best solution. While traditional DCA buys at set time intervals, grid trading optimizes this by buying during dips and selling during minor bounces within a predefined range.
When you deploy a grid bot during a dip, it automatically places buy orders as the price falls and sell orders as it recovers. This allows you to accumulate assets during "sideways" volatility without needing to manually time the market.
Strategy 3: The Confirmation BuyFor conservative traders, the Confirmation Buy is the safest way to buy the dip. Instead of catching the asset while it is still falling, you wait for the market to prove that the bottom is actually in.
Look for two specific signals:
Green Candle Confirmation: Wait for a strong bullish candle to close on a higher timeframe (4H or Daily) after a series of red candlesRSI Crossover: Wait for the RSI to dip below 30 and then cross back above the 30 lineThis crossover confirms that downward momentum has shifted back to the upside. While you might miss the absolute bottom by 2-3%, you gain the security of knowing you aren't buying into a continuous crash.
Is It a Dip or a Market Crash? How to Tell the DifferenceSuccessful crypto trading requires more than just looking at a red candle; it requires context. Identifying a profitable dip means looking past the immediate price action to understand the fundamental "why" behind the decline.
How to Identify Healthy DipsA "healthy" dip is a natural part of a functioning market, often occurring during an established bull run. These pullbacks act like a "reset button," clearing out over-leveraged positions and allowing the market to build a stronger foundation for the next leg up.
Look for:
Profit-taking cycles where early investors lock in gainsShort-term FUD that doesn't change a coin's core utilityCascading liquidations from over-leveraged tradersTrend Reversals: The Danger ZoneA dip becomes a disaster when the underlying trend changes from bullish to bearish. Watch out for:
Broken fundamentals like security breaches or team departuresLower highs and lower lows on the chartsHigh volume on the drop indicating "smart money" is exitingCommon Mistakes to Avoid When Buying the Crypto DipBuying the crypto dip can be effective, but only when you avoid common mistakes:
Avoid "catching a falling knife": A sharp drop does not guarantee a bottom; assets that fall 50% can still fall further without confirmation of price stabilizationDon't FOMO into the first red candle: Early entries on small pullbacks often lead to lossesUse stop-loss orders without exception: Place stop-losses just below key support levelsControl position size: Risk no more than 1–2% of your total trading capital per tradeBe cautious with leverage: Beginners should stick to spot trading to avoid liquidationHow to Buy the Dip on WEEX ExchangeReady to put these strategies into practice? WEEX offers a secure platform with zero fees and instant execution.
Step 1: Create Your WEEX AccountVisit the WEEX website or download the app. Sign up with email or phone, verify, and complete KYC.
Step 2: Deposit FundsGo to "Assets" → "Deposit" Add funds via bank transfer, card payment, or send USDT from another wallet.
Step 3: Identify Your DipUse the technical tools discussed—support levels, RSI, and moving averages—to spot high-probability entry points.
Step 4: Execute Your TradeChoose your entry strategy: ladder approach, market order, or limit order. Set your stop-loss immediately.
Step 5: Manage Your PositionMonitor the trade, adjust stop-losses as the price moves in your favor, and stick to your exit plan.
Why WEEX? Zero fees, instant execution, deep liquidity, and institutional-grade security.
Final Thoughts: Discipline Over EmotionBuying the dip is one of the most rewarding strategies in crypto trading, but it requires a blend of technical skill and emotional discipline. By identifying healthy corrections, using tools like RSI and moving averages, and strictly following risk management rules, you can turn market volatility into your greatest advantage.
Success doesn't come from catching every single bottom; it comes from having a plan before the red candles appear.
Ready to build your dip-buying strategy? WEEX offers zero fees, instant execution, and the tools you need to trade with confidence. Register on WEEX Now and Start Trading
FAQQ1: What is the difference between a "dip" and a "crash"?A: A dip is a temporary price decline within an overall healthy uptrend. A crash or trend reversal occurs when the underlying fundamentals break, leading to a long-term bearish shift with lower highs and lower lows.
Q2: When is the best time to buy the dip?A: The safest time is when you see confluence—multiple technical signals lining up. Look for price hitting historical support while the RSI crosses back above 30.
Q3: How much leverage should I use when buying a dip?A: Beginners should stick to spot trading (0x leverage). Intermediate traders should keep leverage low at 2x–5x to provide breathing room during volatility.
Q4: What's the best dip-buying strategy for beginners?A: Start with the Confirmation Buy strategy and spot trading. Focus on major cryptocurrencies with strong fundamentals and use limit orders to control entry prices.
9 Crypto Terms Every Crypto Trader Should Know
Description: New to crypto? Learn the most important crypto terms—blockchain, smart contracts, DeFi, tokenomics, and more. Complete beginner's guide to understanding cryptocurrency.
Entering crypto can feel like learning a new language. The industry moves fast, and new terms pop up constantly. Whether you're just starting out or brushing up, knowing the fundamental crypto terms is essential for navigating this space safely.
Crypto has its own vocabulary. Concepts like blockchain, smart contracts, and private keys help you use crypto with fewer mistakes. Not all blockchains work the same—understanding Proof of Work vs. Proof of Stake, gas fees, and tokenomics explains why networks have different costs, speeds, and risks.
This guide breaks down 9 essential cryptocurrency terms every user should know.
1. BlockchainAt its core, a blockchain is a distributed, digital ledger that records transactions across a network of computers. Unlike a traditional bank ledger controlled by a single entity, a blockchain is decentralized, meaning it's maintained by multiple users instead of a central authority.
The data is stored in "blocks" that are linked together in a chronological "chain." Once information is recorded on the blockchain, it's extremely difficult to change, making the system transparent and secure against tampering.
Why it matters: Understanding blockchain helps you grasp why crypto is considered secure and transparent. Every cryptocurrency you trade relies on this underlying technology.
2. DecentralizationDecentralization refers to the transfer of control and decision-making from a centralized entity (individual, organization, or group) to a distributed network. In the context of crypto, decentralization aims to reduce trust issues and improve security.
For example, Bitcoin allows peer-to-peer transactions without intermediaries like banks. It's worth noting, however, that decentralization exists on a spectrum; some networks are more decentralized than others.
Why it matters: Decentralization is what makes crypto different from traditional finance. When you hear "not your keys, not your coins," that's decentralization in action.
3. Smart ContractsSmart contracts are self-executing contracts with the terms of the agreement directly written into code. The most popular smart contracts run on highly programmable blockchains like Ethereum, BNB Chain, and Solana.
Think of a smart contract like a vending machine: if you insert the correct amount of money and select an item (the input), the machine automatically releases the product (the output) without a shopkeeper needing to be present. This automation enables the creation of all sorts of decentralized applications (DApps) and eliminates the need for middlemen in many processes.
Why it matters: Smart contracts power everything from DeFi lending to NFT marketplaces. They're the engine behind most crypto innovation.
4. Decentralized Finance (DeFi)DeFi refers to an ecosystem of financial applications built on blockchain networks. The goal of DeFi is to create an open-source, permissionless, and transparent financial service ecosystem that is available to everyone and operates without any central authority.
DeFi users can engage in activities such as lending, borrowing, and trading directly with others or via smart contracts, rather than going through traditional intermediaries like banks.
Why it matters: DeFi has grown into a multi-billion dollar ecosystem offering yields, trading, and financial services to anyone with an internet connection. Understanding DeFi opens up new ways to use your crypto.
5. TokenomicsTokenomics (a combination of "token" and "economics") refers to the economic structure of a cryptocurrency, NFT, or any other digital asset. It's related to the supply and demand characteristics of a token.
Key aspects of tokenomics include:
Total supply: The number of tokens that currently exist and are either in circulation or lockedCirculating supply: The number of tokens currently available in the marketUtility: What the token is used for (e.g., paying fees, governance voting)Distribution: How tokens are allocated to the team, investors, and the communityWhy it matters: Understanding tokenomics helps investors evaluate the long-term sustainability of a project. A token with poor tokenomics can lose value even if the technology is sound.
6. Gas FeesGas fees are the payments made by users to compensate for the computing energy required to process and validate transactions on a blockchain. For example, on the Ethereum network, gas fees are paid in ether (ETH) and are denominated in gwei.
Gas prices fluctuate based on demand; when the network is busy, fees tend to go up. Understanding how gas fees work can help you time transactions better and avoid overpaying.
Why it matters: High gas fees can make small transactions impractical. Knowing when to trade can save you significant money over time.
7. Private Keys vs. Public KeysThese keys are cryptographic tools used to send and receive cryptocurrency.
Public Key: Think of this as your bank account number or email address. You share this with others so they can send you funds.Private Key: This is like your password or PIN. It proves ownership of the funds associated with your public key. You must never share your private key with anyone. If someone gains access to your private key, they can steal your assets.Why it matters: Your private key is the most important piece of information in crypto. Lose it, and you lose your funds. Share it, and someone else can take them.
8. Seed Phrase: The Master Key to Your WalletA seed phrase (or recovery phrase) is a sequence of 12 to 24 random words generated when you create a crypto wallet. It's the master backup for your entire wallet.
Here's the key difference: a private key unlocks a single specific address (like one Bitcoin account), while a seed phrase restores your whole wallet—including every account and private key derived from it.
If you lose your device, the seed phrase is the only way to recover your funds. But if anyone else finds it, they gain full access to everything in your wallet. Store it offline in a secure place and never share it with anyone.
Why it matters: Your seed phrase is the ultimate backup. Treat it like the keys to a vault—because that's exactly what it is.
9. StablecoinsStablecoins are cryptocurrencies designed to keep a relatively stable price, usually by tracking the value of a traditional currency like the US dollar (aiming to stay close to $1). Many people use stablecoins to move money between exchanges, avoid short-term price swings, or store value on-chain without converting their digital assets back to fiat.
There are different types of stablecoins:
Fiat-backed stablecoins: Backed by reserves such as cash and short-term government debt. Users rely on the issuer to manage reserves properly.Crypto-backed stablecoins: Use cryptocurrency as collateral and often require over-collateralization. They can be more transparent on-chain but may be affected during high volatility.Algorithmic stablecoins: Use mechanisms like supply adjustments to maintain the peg. They can be more fragile and may fail during market stress.Why it matters: Even though they're called "stable," stablecoins are not risk-free. They can depeg (move away from $1), face liquidity problems, or be impacted by regulation, reserves management, or smart contract vulnerabilities. Stick to reputable stablecoins with a proven track record.
How to Start Your Crypto Journey on WEEXNow that you understand the essential crypto terms, you might be ready to put that knowledge into practice. WEEX offers a secure platform with zero fees and instant execution—perfect for beginners and experienced traders alike.
Step 1: Create Your WEEX AccountVisit the WEEX website or download the app. Sign up with email or phone, verify, and complete KYC.
Step 2: Deposit FundsGo to "Assets" → "Deposit." Add funds via bank transfer, card payment, or send USDT from another wallet.
Step 3: Start TradingNavigate to the trading section and explore hundreds of trading pairs. Use your new knowledge to make informed decisions.
Why WEEX? Zero fees, instant execution, deep liquidity, and institutional-grade security.
Final Thoughts: Knowledge Is Your Best InvestmentCrypto becomes much clearer once you understand the core ideas. Concepts like blockchain, smart contracts, and consensus mechanisms explain how networks operate, while tokenomics and gas fees help you navigate costs and incentives.
On the security side, private keys and seed phrases are non-negotiable—lose them, and you lose access to your funds. Stablecoins and DeFi are also essential tools for trading, payments, and on-chain finance.
Keep learning the basics, stay security-conscious, and you'll navigate crypto with confidence.
Ready to start your crypto journey? WEEX makes it simple with zero fees, instant execution, and the security you need. Register on WEEX Now and Start Trading
Frequently Asked Questions About Crypto TermsQ1: What is the most important crypto term for beginners?A: Private key is arguably the most critical term. Your private key proves ownership of your funds—lose it, and you lose access to your crypto permanently.
Q2: What's the difference between Bitcoin and Ethereum?A: Bitcoin primarily serves as digital gold—a store of value. Ethereum is a programmable blockchain that supports smart contracts and decentralized applications.
Q3: What does "gas" mean in crypto?A: Gas fees are payments made to process transactions on a blockchain. They compensate miners or validators for the computing power required.
Q4: Are stablecoins really stable?A: Stablecoins aim to maintain a fixed price (usually $1), but they can "depeg" during market stress. Choose reputable stablecoins with transparent reserves.
Q5: What's a seed phrase and why is it important?A: A seed phrase is a 12-24 word backup that can restore your entire wallet. Never share it online or with anyone—it's the master key to all your funds.

Is Ethereum Still King in 2026? How Ethereum and Layer2 Are Reshaping the Crypto Ecosystem
By early 2026, many people in the 2026 crypto market find themselves scratching their heads about whether Ethereum is still king. The price of Ethereum — commonly referred to simply as ETH — has pulled back nearly 60% from its 2025 highs and sits around $2,000, yet the real story of Ethereum’s role in crypto is far deeper than its price numbers alone. This strange juxtaposition of price weakness and fundamental strength is one of 2026’s most compelling narratives in the Ethereum Layer2 ecosystem.
From the perspective of retail traders, the Ethereum price slide triggers endless debate about whether faster, cheaper chains can replace Ethereum as the core of decentralized finance. But when you zoom out to look at the entire Layer2 ecosystem around Ethereum — supported by actual usage data, institutional flows, and real transaction growth — the picture becomes clearer: Ethereum is not fading; it’s evolving, and Layer2 is the engine of that evolution.
In fact, institutional players like traditional financial institutions have quietly doubled down on Ethereum, not abandoned it. TradFi institutions continue building financial infrastructure on Ethereum, deploying smart contracts, tokenizing assets, and using Layer2 solutions, which reflects deeper confidence in Ethereum’s future regardless of short‑term price noise.
Why the Ethereum Narrative Changed in 2026For years, Ethereum has been the bedrock of decentralized finance and the broader Web3 ecosystem, powering thousands of applications and billions of dollars in locked‑in value. But in 2026, the conversation has shifted. Instead of asking whether Ethereum can scale, the industry is now asking: has Ethereum already solved its scaling problem — or has the rise of Layer2 networks transformed what Ethereum actually is?
Today, Ethereum is no longer just a blockchain — it has become the secure settlement layer underpinning a growing multi‑layer financial infrastructure. With the Layer2 ecosystem now absorbing most of the user activity that once congested Ethereum’s mainnet, Ethereum’s core role is to provide security, decentralization, and settlement for a vast network of Layer2 rollups.
This shift didn’t happen by accident. Ethereum’s 2024 Dencun upgrade introduced data blobs, dramatically reducing Layer2 fees. Follow‑up improvements like the Pectra hard fork continued to increase blob capacity, lowering Layer2 costs even further and fueling massive adoption across networks like Arbitrum, Optimism, Base, zkSync, and Starknet. Transaction costs that once spiked into the tens of dollars are now often fractions of a cent — a transformative change for everyday users.
By the time 2026 rolled around, analysts were already reporting that Ethereum Layer2 networks collectively processed more than 500 million transactions, with transaction costs on Layer2 dropping up to 99% compared to the Ethereum base layer.
The Layer2 Explosion: What It Really MeansThe Layer2 explosion isn’t just hype — it’s backed by important growth data. In early 2026, multiple sources show that Layer2 networks generate significant economic activity. For example, Layer2 networks generated around $50 million in monthly revenue, with leading solutions like Base and Arbitrum capturing the majority of that income.
More importantly, Layer2 solutions process the vast majority of Ethereum ecosystem transactions today. Even though Ethereum’s base layer is still critical for security and settlement, most real‑world usage — DeFi trades, transfers, gaming interactions, NFT activity, and more — happens on Layer2. This is a structural evolution: Layer2 is where users actually interact, and Ethereum is where everything ultimately settles.
If you imagine Ethereum as the vault deep underground in a traditional financial system, Layer2 chains are the bustling highways of activity on the surface. Ethereum keeps accounts secure and final, while Layer2 handles the busy transaction traffic.
This expansion of the Layer2 ecosystem also shows in global throughput numbers. Ethereum’s overall transaction processing capacity (TPS) has surged significantly, driven by Layer2 adoption. Analysts noted that Ethereum’s TPS peaked at nearly 58,000 transactions per second, a massive jump thanks to Layer2 networks absorbing major traffic.
Ethereum Still Dominates DeFi LiquidityDespite all the talk about alternative blockchains and Layer1 competitors, Ethereum remains the undisputed leader in decentralized finance (DeFi). Even in a market where price action is subdued, Ethereum commands the largest share of global DeFi TVL — often capturing more than two‑thirds of the total value locked across all DeFi protocols.
This dominance isn’t just theoretical — it’s evidenced by how major financial protocols continue to operate mainly within Ethereum’s ecosystem. Decentralized exchanges, lending protocols, liquid staking platforms, and tokenized real‑world asset markets all rely on Ethereum’s deep liquidity and robust security guarantees. Liquidity begets liquidity, and that’s why institutional players — from banks to asset managers — keep placing their largest bets on Ethereum.
One topic frequently discussed on social media and Twitter is how stablecoins on Ethereum continue to dwarf those on rival chains, reflecting real economic activity and not just speculative trades. That’s another layer of credibility for Ethereum’s long‑term role as a global settlement network for stable value transactions.
Growing Competition Yet Deeper EcosystemOf course, Ethereum isn’t facing zero competition. Blockchains like Solana have positioned themselves as fast, low‑fee alternatives with simple single‑chain models that attract trading bots, meme coins, NFTs, and high‑frequency retail activity. Solana’s ecosystem growth — driven by ultra‑cheap fees and quick block times — is legitimate and exciting.
But here’s where comparisons matter: Solana may win on raw speed or simplicity, but it hasn’t matched the ecosystem depth and financial infrastructure that Ethereum has built with its Layer2 networks over many years. Thousands of developers, billions in economic activity, and deep institutional trust make Ethereum’s ecosystem uniquely resilient and multi‑layered.
This isn’t just FUD vs hype — this is a comparison that experienced traders and developers discuss on Twitter and crypto forums daily: transaction cost vs liquidity depth, single‑chain simplicity vs multi‑layer financial complexity, short‑term activity vs long‑term infrastructure. The lesson many come to is that Ethereum and Layer2 serve a different purpose than chains built solely for niche applications.
Does Layer2 Reduce Ethereum’s Value?A common question among ETH holders is: If most activity moves to Layer2, does Ethereum still capture enough economic value?
This debate is real, and you see it everywhere from Twitter threads to research discussions. Layer2 networks increasingly capture transaction fees — sometimes more than Ethereum’s base layer — because users transact more frequently on Layer2. That revenue accrues to Layer2 sequencers, not directly to Ethereum validators.
However, many analysts argue that Layer2 growth ultimately strengthens Ethereum, because it expands total ecosystem activity and bolsters Ethereum’s security by drawing more value into a system that all settles back onto Ethereum. In other words, Layer2 doesn’t replace Ethereum — it scales it.
Most importantly, Ethereum’s base layer remains the ultimate anchor of security and decentralization, which is why institutions continue to build on it even if granular economic value accrues first on Layer2.
Institutional Interest in Ethereum Remains StrongIn 2026, institutional interest in Ethereum hasn’t waned — it has been quietly building. After the approval of major crypto ETFs, large financial players began exploring programmable finance on Ethereum. That includes tokenized funds, stablecoins backed by regulated institutions, and DeFi protocols designed specifically for professional capital flows.
This trend shows up in both traditional financial analysis and on crypto social feeds: institutions aren’t ignoring Ethereum’s price action; they’re building on its foundational strength. For many decision‑makers, Ethereum isn’t an “asset to trade” — it’s an infrastructure to leverage, much like they would treat a settlement network or financial rail in the traditional world.
Why This Matters for Traders and the 2026 Crypto MarketUnderstanding Ethereum and Layer2 isn’t just academic — it opens up real ETH trading opportunities for participants in the 2026 crypto market. Engagement with Ethereum isn’t limited to long‑term HODLing; it also includes active trading, strategic DeFi deployment, and Layer2‑based strategies.
Platforms like WEEX Exchange recognize the importance of this evolving Ethereum Layer2 ecosystem and help users capture these opportunities with features tailored to both beginners and advanced traders. WEEX supports seamless spot trading of ETH and major Layer2 tokens like ARB and OP, often offering zero‑fee ETH/USDT promotions that make entering or scaling positions easier. For more experienced traders, WEEX offers futures trading with up to 200x leverage in both USDT‑M and Coin‑M contracts, allowing traders to take advantage of volatility and directional moves in ETH and Layer2 assets.
Beyond trading, WEEX provides a user‑friendly cross‑chain experience where Layer2 assets can be bridged and managed directly within the app — a key advantage as Ethereum’s multi‑layer model continues to grow. Special campaigns like the “Layer2 Carnival Week”, which rewards users with trading fee rebates when trading popular Layer2 tokens, make it more engaging than ever to participate in the broader Ethereum ecosystem.
Final Thoughts: Ethereum in 2026 and BeyondIn 2026, Ethereum’s story isn’t about whether it is still the king — it’s about how it has evolved into the backbone of a multi‑layer financial ecosystem. Layer2 adoption has changed where users interact, but Ethereum remains the foundational settlement layer that secures and finalizes the billions of dollars in economic activity flowing through DeFi, stablecoins, tokenized assets, and more.
Competitors may excel in niche areas like transaction speed or retail appeal, but none have replicated Ethereum’s depth of liquidity, developer ecosystem, or institutional trust. The real question isn’t whether Ethereum remains dominant; it’s whether any ecosystem can rival the scale and complexity of the Ethereum Layer2 network emerging in the 2026 crypto market — a network that continues to grow, innovate, and anchor the future of decentralized finance, one Layer2 transaction at a time.

Bear Market 2026: How to Survive and Thrive When Crypto Prices Fall
The possibility of a 2026 crypto downturn is already shaping conversations across the market. Whether it arrives suddenly or unfolds gradually, bear markets are a recurring part of the cycle. Prices fall, sentiment weakens, and confidence gets tested.
But here's the thing history shows us: downturns also reward discipline and preparation. Surviving a bear market isn't about predicting the exact bottom. It's about protecting capital, staying rational, and positioning yourself for the eventual recovery.
This guide walks through exactly what to do in a bear market—practical steps to manage risk, build positions, and even generate crypto income while prices are down.
Read More: User Guide: What to Do in a Crypto Bear Market?
What Actually Happens in a Bear Market?Before diving into strategy, let's understand what we're dealing with. A bear market is a prolonged period of declining prices, typically defined as a drop of 20% or more from recent highs. But in crypto, bear markets can be brutal—drawdowns of 70-80% aren't uncommon.
Key characteristics of crypto bear markets:
Extended price declines across most assetsLow trading volume and reduced liquidityNegative sentiment and media doom loopsProject failures and exchange turbulenceCapitulation events where weak hands sell at a lossThe good news? Bear markets eventually end. The traders who come out ahead aren't the ones who avoid every dip—they're the ones who manage risk effectively and stay in the game long enough for the next bull market to arrive.
How to Survive Bear Market: Essential StepsStep 1: Restructure Your Risk ManagementThe first step in any bear market survival guide is to reassess risk management. During bull markets, it's common for traders to loosen discipline. Profits accumulate easily, leverage becomes tempting, and stop losses may feel unnecessary. In a downturn, those habits can quickly become costly.
Review Your Portfolio AllocationStart by looking at how much exposure you have to high-volatility assets compared to more established cryptocurrencies. Diversification doesn't eliminate risk, but it can reduce the impact of a sharp decline in any single token.
Position sizing is equally important. Smaller allocations per trade allow you to withstand multiple losses without damaging your overall capital. A good rule of thumb: never risk more than 1-2% of your account on a single position.
Refine Your Trading PlanDefine clear entry criteria and exit rules. Decide in advance where you'll reduce exposure if the market moves against you. A written plan helps prevent impulsive decisions when prices are swinging wildly.
Bear markets often include sharp relief rallies that can tempt traders into chasing momentum. These "dead cat bounces" can be traps. Stick to your plan.
Manage LiquidityHolding some capital in stable assets gives you flexibility. It provides the ability to deploy funds when opportunities arise rather than being fully invested at unfavorable levels. In many cases, survival in a downturn depends less on how much you earn and more on how much you avoid losing.
Risk management during a bear market isn't defensive for its own sake. It's a strategy to ensure you remain active and capable of participating when the next growth phase begins.
Step 2: Build Long-Term Positions Through DCAThe second step focuses on disciplined accumulation. Dollar cost averaging (DCA) is a method of investing fixed amounts at regular intervals regardless of short-term price fluctuations. In a declining market, this approach can reduce the psychological pressure of trying to identify the exact bottom.
How DCA Works in PracticeInstead of deploying all your capital at once, divide your investment into smaller portions over time. For example, instead of buying $10,000 worth of Bitcoin today, you might invest $1,000 per week for ten weeks.
This strategy smooths entry prices and reduces the impact of temporary volatility. For long-term investors who believe in the broader growth of blockchain technology, downturns may present opportunities to accumulate quality assets at lower valuations.
Choose Your Assets CarefullyDCA shouldn't be applied indiscriminately. Research remains essential. Focus on projects with strong fundamentals, clear development progress, and active ecosystems. Avoid spreading capital too thinly across speculative tokens without long-term prospects.
A bear market often reveals which projects continue building and which ones fade away. Look for teams that ship code, maintain community, and manage treasury responsibly.
Step 3: Generate Crypto Income While You WaitOne of the smartest what to do in bear market strategies is finding ways to generate crypto income while prices are down. Here are some approaches:
StakingMany Proof-of-Stake networks offer staking rewards for holding their tokens. During a bear market, these yields provide a way to accumulate more coins at lower prices. Ethereum, Solana, and numerous other projects offer staking options with varying lock-up periods.
WEEX Staking makes it easy to put your crypto to work. With flexible and fixed-term options, competitive APRs, and institutional-grade security, you can earn passive income while holding through the downturn. No complex setups—just deposit, stake, and let your assets grow. Register on WEEX Now and Start Staking
Read More: Beginner's Guide to WEEX Staking
LendingPlatforms like Aave and Compound allow you to lend assets and earn interest. Stablecoin lending can provide predictable yields without exposure to price volatility.
Step 4: Learn and AdaptBear markets offer something precious: time. When price action slows and volatility compresses, you have the opportunity to improve your knowledge.
What to StudyMarket structure and price action analysisOn-chain data and metrics like NVT ratio, MVRV, and realized capMacroeconomic influences on crypto marketsRisk models and position sizing techniquesTokenomics and project fundamentalsEducation broadens perspective. Instead of focusing solely on short-term trading, explore areas such as decentralized finance mechanisms, staking models, and regulatory developments. A deeper understanding helps you distinguish between temporary noise and structural shifts.
How to Trade Crypto on WEEX During a Bear MarketFor active traders, structured platforms become increasingly important. WEEX provides tools designed to manage risk more effectively, including clear order book visibility and portfolio tracking.
Getting Started on WEEXRegister for a WEEX account and complete identity verificationDeposit funds into your account (USDT or other supported assets)Navigate to the trading section and select your preferred trading pairUse limit orders to control entry pricesApply stop losses on every positionReview open positions regularly to manage downside riskWhy WEEX Works in Bear MarketsZero fees on many pairs—more capital working for youDeep liquidity for smoother executionInstitutional-grade security to protect your assetsPortfolio tracking for clear oversightRisk management tools including stop losses and take profitsTrading during a downturn requires patience and discipline. Structured tools support consistent decision-making. By combining education with careful execution, you transform a challenging period into a phase of preparation.
Final Thoughts: How to Survive the Bear MarketIf the 2026 bear market arrives, it will test every trader's confidence and strategy. Surviving isn't about luck—it's about four core actions: restructure your risk management, apply disciplined dollar cost averaging to build long-term positions, generate crypto income through staking or lending while prices are down, and invest time in learning while using structured platforms like WEEX for clearer oversight.
Bear markets aren't just periods of decline. They're phases of consolidation and preparation. With careful planning and the right tools, you can protect your portfolio and stay ready for the next cycle.
Ready to trade with confidence? WEEX offers zero fees, instant execution, and the security you need. Register on WEEX Now and Start Trading
FAQQ1: What is the most important factor in surviving a bear market?A: Strong risk management and disciplined capital allocation are often the most critical elements. Protecting downside allows you to stay in the game.
Q2: Is dollar cost averaging effective in a downturn?A: Yes. DCA helps smooth entry prices over time, especially for long-term investors who believe in the asset's fundamentals. It removes the pressure of timing the bottom.
Q3: Should I stop trading completely during a bear market?A: Not necessarily. Some traders remain active, but they typically reduce position sizes and apply stricter risk controls. Range-bound markets can offer opportunities.
Q4: How can I generate crypto income during a bear market?A: Options include staking, yield farming on stablecoins, lending, and options strategies. Each carries its own risks—research thoroughly before committing funds.
Q5: How long do crypto bear markets typically last?
A: Historically, crypto bear markets have lasted anywhere from 6 months to over 2 years. The 2018 bear market extended through most of the year, while 2022 saw declines continue into 2023.
Q6: What's the difference between a bear market and a correction?
A: A correction is a short-term decline of 10-20%. A bear market is a prolonged period of decline, typically 20% or more from recent highs, lasting months or longer.
Q7: Can you make money in a bear market?
A: Yes, through shorting, options strategies, or accumulating assets at lower prices for the next cycle. But it's harder and requires more skill than bull markets.
Q8: How do I protect my portfolio in a market decline?
A: Diversification, smaller position sizing, stop losses, and maintaining some stable assets for flexibility can all help reduce risk.
Q9: What assets perform best in bear markets?
A: Stablecoins preserve capital. Bitcoin often holds up better than smaller altcoins. Some traders move to cash and wait for opportunities.
Q10: How do I know when a bear market is ending?
A: Signs include prolonged consolidation, capitulation events, positive developments overcoming negative news, and technical indicators like higher lows forming.

WEEX Crypto Tax Guide: How to Export Trading Data and Generate a Tax Report with KoinX
As cryptocurrency adoption continues to grow, tax reporting has become an important responsibility for traders in many regions. In countries such as the United States and Canada, digital asset transactions may be subject to tax reporting requirements, making accurate transaction records essential for proper filing.
For active United States and Canada traders, organizing transaction history across spot and derivatives markets can sometimes be complex. Multiple trades, fees, funding payments, and realized gains or losses all need to be properly documented when preparing tax reports.
To support users during tax season, WEEX has partnered with KoinX, a crypto tax reporting solution designed to help traders organize their transaction data and generate tax reports more efficiently.
In this guide, we will walk you through how to export your transaction history from WEEX and prepare it for crypto tax reporting.
How to Export Your WEEX Transaction History for Tax ReportingFollow the steps below to export your trading records and prepare them for use with crypto tax reporting tools.
Step 1: Create a Tax APIFirst, create a Tax API on WEEX and securely save your Passphrase, API Key, and Secret Key.
API page: https://www.weex.com/account/newapi
1. Go to the API management page and click “Create New API.”
2. Complete the required fields and finish the security verification. In the Permission Settings section, select “Account Details” only. Make sure to record the Passphrase, as you will need it later.
3. After clicking “Next,” your API will be created successfully. Be sure to save your Access API Key and Secret Key securely, as they will be required for the next steps.
Step 2: Fill Out the Application Form to Enable API PermissionsComplete the Tax API Application Form. The team will process your application within 24 hours and notify you by email.
Form link: https://dsg39hlwl5ui.sg.larksuite.com/share/base/form/shrlgWk2VVKKGpRLU9M58oblbdb
Notes: All information in the form must match the details used when creating the API and the corresponding account.
Step 3: Obtain Your Tax ReportGo to the KoinX platform and use the Passphrase, Access APIKey, and Secretkey collected when creating the Tax API in Step 1. Follow the steps to select the WEEX exchange and import your transaction data. Then select “Tax Reports” in the left sidebar to obtain your tax report.
https://app.koinx.com/overview
1. After logging in to KoinX, go to “ Integrations” on the homepage. Enter “WEEX” in the search bar to quickly find the WEEX icon and click to proceed.
2. Enter the Tax API “Passphrase,” “Access APIKey,” and “Secretkey,” then click “Import Now” to import your account’s transaction data. After submitting the API, the system will begin importing the trading data. This process may take some time.
3. After the transaction data has been successfully imported, you can view your WEEX account data under “Portfolio → Dashboard.”
4. Go to “Tax Reports” and select the tax report you wish to export. Then click “Generate” at the bottom of the page to complete the export.
5. Proceed to the payment page. Be sure to use the WEEX discount here.
6. After completing the payment, KoinX will send the tax report to the email address linked to your account.
Step 4: Check Your Email for the Tax ReportThe tax report will be sent to the email address linked to your KoinX account.
Final ThoughtsPreparing accurate transaction records is an important part of responsible crypto trading, especially as regulatory expectations continue to evolve. By organizing your trading history and maintaining clear documentation, you can simplify the reporting process and reduce potential errors during tax season.
Through the WEEX × KoinX partnership, users now have access to a more structured way to organize transaction records and prepare documentation for tax reporting.
For detailed tax guidance, users should always consult a qualified tax professional or review the official regulations applicable in their jurisdiction.
*Disclaimer: WEEX does not provide tax, legal, or financial advice. Users should consult a qualified tax professional regarding their individual tax obligations.
About WEEXFounded in 2018, WEEX has developed into a global crypto exchange with over 6.2 million users across more than 150 countries. The platform emphasizes security, liquidity, and usability, providing over 1,200 spot trading pairs and offering up to 400x leverage in crypto futures trading. In addition to the traditional spot and derivatives markets, WEEX is expanding rapidly in the AI era — delivering real-time AI news, empowering users with AI trading tools, and exploring innovative trade-to-earn models that make intelligent trading more accessible to everyone. Its 1,000 BTC Protection Fund further strengthens asset safety and transparency, while features such as copy trading and advanced trading tools allow users to follow professional traders and experience a more efficient, intelligent trading journey.
Follow WEEX on social mediaX: @WEEX_Official
Instagram: @WEEX Exchange
Tiktok: @weex_global
Youtube: @WEEX_Official
Discord: WEEX Community
Telegram: WeexGlobal Group
US-Iran Tensions Boil Over: How War Rewires the Crypto Market
In an era of intensifying geopolitical friction, the crypto market is reacting to and absorbing shocks far faster than traditional finance (TradFi).
Trade here: [BTC/USDT] | [XAUT/USDT] | [XAG/USDT]
Trade here:Gold & silver 0% fees
Middle East Escalation: Bitcoin Leads the "War Premium"Over the past 96 hours, the global order has been shaken to its core. As the only 24/7 financial frontline, the crypto market has been the first to "foot the bill" for the war premium:
February 28: The US and Israel launch massive airstrikes, deploying over 1,200 missiles. Bitcoin (BTC) flash-crashes 4.4%, while Gold and Crude Oil spike 1.3% and 4%, respectively.Same day: Reports confirm the death of Iran’s Supreme Leader Khamenei and several high-ranking officials. As rumors of the "decapitation strike" conclude, BTC stages a aggressive V-shaped recovery, while Gold enters a consolidation phase.March 1–2: Iranian forces retaliate with missile strikes against US and Israeli positions. While the Foreign Ministry initially denies intentions to block the Strait of Hormuz, the Islamic Revolutionary Guard Corps (IRGC) officially closes the chokepoint on March 2, sending oil prices into the stratosphere.March 3: Donald Trump asserts US military superiority, stating the military is "locked and loaded." Concurrently, capital flight from Iranian crypto exchanges surges by 700%.Because traditional markets are closed over the weekend, crypto has become the ultimate "relief valve" and 24/7 outlet for investors to hedge risks and bet on real-time developments.
A Look at the Rearview Mirror: History Doesn’t Repeat, But It RhymesPast geopolitical conflicts show a strikingly consistent pattern: Short-term emotional shockwaves followed by mid-to-long-term rallies driven by safe-haven demand and liquidity expectations.
2022 Russia-Ukraine War: BTC dropped 7% on Day 1 but rallied 25% within a month.2023 Israel-Hamas Conflict: BTC dipped 5% in a week, only to surge over 80% three months later.2025 Iran-Israel Clash: An initial 7.5% weekly slide was followed by a 25% recovery within 30 days.When chaos breaks out, liquidity is often the first casualty, and Bitcoin usually bears the brunt of the initial "sell everything" panic. However, its identity as a "non-sovereign asset" eventually brings it back to its original trajectory—and often beyond.
"This Time is Different": The New GuardTo be specific, the market resilience is markedly stronger than before.
Since the fourth halving, institutional players have taken the wheel. While the current conflict is arguably more intense than previous ones, Bitcoin’s drawdowns are shallower and shorter.
Simultaneously, spot ETFs and institutional "Diamond Hands" are playing the long game; they don’t liquidate over weekend headlines. This structural maturity provides a massive liquidity buffer that absorbs emotional selling.
The conflict is far from over. If the Strait of Hormuz remains blocked for the long haul, the market narrative will shift from a simple "inflation hedge" to a "global recession defense".
While the smoke of war has been seen, a new financial order is quietly taking root on-chain. We are keeping a close monitor.

How to Earn Passive Income with USDC: WEEX Launches Flexible USDC Staking
WEEX officially introduces USDC Staking, a flexible and stable earning product designed for users who want to grow their digital assets efficiently while maintaining liquidity. With competitive APR, low entry threshold, and flexible redemption, USDC Staking provides a simple and secure way to generate passive income directly within the WEEX ecosystem.
Whether you are an active trader optimizing idle capital or a long-term holder seeking steady returns, WEEX USDC Staking is built to enhance capital efficiency in all market conditions.
What Is USDC Staking and How Does It Work on WEEX?WEEX USDC Staking is a flexible earning product that enables users to generate passive income by staking their USDC directly on the WEEX platform. By participating, users receive a competitive annual percentage rate (APR) while maintaining convenient access to their funds.
Designed for simplicity and efficiency, WEEX USDC Staking allows seamless subscription and redemption within the WEEX App and Web. There is no need for on-chain transfers, external wallets, or complex DeFi operations — users can start earning with just a few clicks from their WEEX account.
Why Stake USDC? Benefits of Earning Yield on StablecoinsStablecoins play a crucial role in digital asset portfolios. USDC, as one of the most widely adopted stable assets, is widely used as trading collateral, a hedging tool during volatile market conditions, and a core asset for capital allocation across different strategies. Its price stability makes it an essential component for both active traders and long-term investors managing risk exposure.
However, idle USDC often generates no return. WEEX USDC Staking addresses this inefficiency by allowing users to earn yield on their stable assets without sacrificing liquidity or flexibility. By transforming dormant capital into productive assets, it enhances overall capital efficiency — delivering value in both bullish and bearish market cycles.
USDC Staking APR, Flexibility, and Key Advantages on WEEXWEEX USDC Staking offers a competitive and stable 3.5% APR, allowing users to earn consistent returns on their USDC holdings without exposure to significant market volatility. Compared with major platforms such as Coinbase, WEEX provides a market-competitive yield designed to enhance capital efficiency while maintaining stability. This makes it an efficient solution for generating predictable returns with a conservative risk profile.
The product is designed with flexibility at its core. Users can subscribe and redeem funds based on their liquidity needs, without being restricted by long lock-up periods. This ensures greater control over capital allocation, whether for active trading or strategic portfolio management.
In addition, WEEX USDC Staking is fully integrated within the WEEX ecosystem. All operations are completed directly through the WEEX App or Web, eliminating the need for external wallets or complex DeFi interactions. By transforming idle USDC into yield-generating assets, the product enhances overall capital efficiency while preserving accessibility.
Who Should Stake USDC? Benefits for Crypto Traders and Long-Term InvestorsFor active traders on WEEX, USDC Staking provides a way to put idle funds to work. Instead of leaving unused USDC sitting in an account between trades, users can generate yield while maintaining the flexibility to reallocate capital when new market opportunities arise.
For long-term holders and risk-conscious investors, USDC Staking offers a relatively stable income option within the platform. By earning yield on stable assets, users can enhance portfolio performance without taking on additional exposure to price volatility.
Overall, WEEX USDC Staking improves capital efficiency across different user profiles. Whether optimizing short-term liquidity or seeking steady passive returns, users can manage, grow, and access their assets seamlessly within the WEEX ecosystem.
About WEEXFounded in 2018, WEEX has developed into a global crypto exchange with over 6.2 million users across more than 150 countries. The platform emphasizes security, liquidity, and usability, providing over 1,200 spot trading pairs and offering up to 400x leverage in crypto futures trading. In addition to the traditional spot and derivatives markets, WEEX is expanding rapidly in the AI era — delivering real-time AI news, empowering users with AI trading tools, and exploring innovative trade-to-earn models that make intelligent trading more accessible to everyone. Its 1,000 BTC Protection Fund further strengthens asset safety and transparency, while features such as copy trading and advanced trading tools allow users to follow professional traders and experience a more efficient, intelligent trading journey.
Follow WEEX on social media:X: @WEEX_Official
Instagram: @WEEX Exchange
Tiktok: @weex_global
Youtube: @WEEX_Official
Discord: WEEX Community
Telegram: WeexGlobal Group

BTC Approaches $60K: Crypto Isn't Dead, It's Just Filtering the Noise
Macro disturbances, leverage collapses, and sluggish trading volumes are the hallmarks of every crypto bear market.
Let's temporarily step back from the AI bubble of June 2028 and focus on the crypto market in February 2026. Recently, BTC has fallen back to the $60K level, and the market is quiet and sluggish. We've reached another critical juncture where we should learn from history.
To truly grasp the "chill" in 2026, we first need to break down what happened during those "freezing moments" in previous bear markets.
The ICO Bubble Burst and Regulatory Winter of 20182018 marked a full year of the crypto market swinging from euphoric bull runs to a deep freeze bear phase. Bitcoin plummeted from its late — peak of nearly $20,000 to around $3,200 in 2017, with the overall market cap evaporating by over 80%. The industry went through the growing pains of shifting from wild speculation to more grounded buildings.
The key themes of this bear market were "liquidity drought and shattered faith."
The macro environment back then was brutally harsh:
- Global economic recovery was sluggish, and the Fed kicked off a rate-hike cycle, raising rates four times that year and ending with the federal funds rate at 2.25%-2.50%;
- China had already banned ICOs and exchanges the previous year, and in 2018, the U.S. SEC ramped up scrutiny and lawsuits, with many countries and regions following suit with their own bans.
At the same time, the massive wealth-creating ICO frenzy from 2017 finally popped, with hacks hitting platforms like Mt.Gox and Bitfinex fueling the panic. Many mining operations have been shut down in droves, and "blockchain is a scam" became the mainstream media's go-to narrative.
In terms of impact, this bear cycle wiped out over 95% of ICO projects, but as every cloud has a silver lining, it paved the way for the DeFi boom in the next bull run. Some institutions started dipping their toes into Bitcoin on a small scale.
The Leverage Meltdown and Rate-Hike Crisis of 2022In 2022, Bitcoin tumbled from $69,000 to around $15,000, with the drop less severe than in 2018.
Compared to 2018, the 2022 bear market was also fueled by macro disruptions and a restructuring of the existing ecosystem.
Macros sucked up liquidity like a vacuum:
- Post- pandemic economies were dealing with persistent high inflation, and the Fed hiked rates seven times to 4.25%-4.50%, marking the fastest, largest, and most frequent dollar rate increases since 1982.
- Regulatory pressures escalated again, with the EU reaching key agreements on MiCA regulations, and the U.S. SEC tightening enforcement on stablecoins and exchanges.
Inside the crypto space, it was a chain reaction starting with the Terra/Luna algorithmic stablecoin collapse, which dragged down Celsius, Three Arrows, FTX, and others into bankruptcy. Sectors like NFTs, GameFi, and the metaverse fell into a deep slumber.
Even though the market turned chilly once more, long-term holders (LTH) started hitting record-high holdings, institutions like MicroStrategy ramped up their stakes dramatically, and the purge of CeFi ecosystems sped up the rise of self-custody, Layer2 solutions, and more.
In-depth compliance review in 2026Heading into 2026, Bitcoin has broken below $80K, $70K, and $60K one after another. The Fear & Greed Index has spent a whopping 26 days in extreme fear territory over the past month, and Google searches for "Bitcoin is dead" have spiked to all-time highs—familiar bear market vibes making a comeback.
Compared to the past, the spread of market risks has intensified short-term sell-offs, but the underlying logic is a bit different:
- Even though we're in a mild rate-cutting phase right now, as we discussed in "Gold & Silver Hit New Highs, Is Bitcoin's Safe-Haven Narrative Losing Its Luster?", funds are flocking to gold and silver for shelter amid escalating sovereign debt crises, U.S. tariff trade wars, and potential threats to Fed independence. A certain number of crowds even reckon that AI has overtaken Web3 as the hot tech story, putting crypto right in the crosshairs.
- On the regulatory front, U.S. crypto policies have turned more friendly, but the odds of the CLARITY bill passing have taken a nosedive.
Of course, in this round of innovation narratives, we've seen a ton of high-funding, high-FDV infrastructure projects without real revenue keep tumbling. Narratives like Layer2, Restaking, and Memecoins have gone quiet, while the ETF story has ushered in an institution-dominated era. Right now, privacy, prediction markets, and stablecoins are still leading the pack.
If we look at volatility, as shown in the chart below, Bitcoin's 60-day average volatility has been trending downward year by year—a clear shift. Unlike the bubble bursts of 2018 or the leverage blowups of 2022, 2026 feels more like a weary adjustment. Although it was cold, it felt more like a mild winter.
While it's too early to call it the "market bottom", it's clear that the chill in 2026 isn't the dramatic crash of old bear cycles — more like a deep recalibration in this era of hyper-compliance.
For investors, the long-term upward potential in crypto markets far outweighs the downside risks. However, where will the next wave of narratives pivot to? As the proverb says, "Time will tell" — let's keep our eyes peeled.
Buy Crypto with Mercadopago on WEEX P2P – 0 Fee & 24/7 ARS Merchants
Mercadopago is widely recognized in Argentina as a trusted and reliable option for fast and seamless cryptocurrency purchases using ARS. With WEEX P2P, users can buy crypto directly through Mercadopago with zero fees, access 24/7 verified merchants, and enjoy ultra-fast release times.
Compared with Binance, Bybit, and local OTC platforms, WEEX consistently offers better ARS exchange rates, safer escrow protection, and more available ads for Mercadopago users.
As crypto adoption continues to rise in Argentina, secure and convenient access to digital assets has become increasingly important. With WEEX P2P, users can buy USDT, BTC, or ETH via Mercadopago with instant processing, 0% buyer fees, and professional merchant support.
What is P2P Trading?
Peer-to-Peer (P2P) trading allows users to buy and sell crypto directly with other users, while the platform acts as a secure intermediary.
On WEEX P2P:
Crypto is held in escrowSellers release assets only after payment is confirmedTrades are processed quickly and safelyThis ensures zero counterparty risk and allows users to pay via local banking methods for a seamless experience.
Why WEEX P2P is the Best Choice for Mercadopago Users
WEEX P2P offers key advantages to users purchasing crypto with ARS via Mercadopago:
0% buyer fees:Save 2–8% compared to competing platforms and maximize the value of every tradeFast release times :Funds are typically released within 1–3 minutes, ensuring a smooth and efficient buying experienceOfficial escrow protection:Platform-managed escrow guarantees 100% transaction safetyFlexible trade sizes:Supports everything from small purchases to large-volume transactionsBest ARS exchange rates for Mercadopago users: Enjoy highly competitive pricing tailored for Mercadopago paymentsThousands of merchants online 24/7: Deep liquidity and constant availability at any time of dayMore Mercadopago ads than any competitor: Greater choice, faster matching, and higher deal completion ratesWhether you’re buying 1,000 ARS or 1,000,000 ARS, WEEX ensures fast, safe, and cost-efficient crypto purchases.
How to Buy Crypto with Mercadopago on WEEX P2P
Buying crypto with Mercadopago on WEEX is simple and fast. Follow these steps:
Register on WEEX and complete basic KYC verification Create your WEEX account and finish the basic identity verification process, which typically takes less than one minute to complete.Navigate to Buy Crypto → P2P Trading From the main menu, enter the P2P trading section and select ARS as your preferred fiat currency.Apply the “Mercadopago” filter Enable the Mercadopago payment filter to view only those merchant advertisements that support Mercadopago Mercadopagos.Select the most suitable merchant Review and compare available merchants based on key indicators, including:Exchange priceOrder completion rateTotal trading volumeReal-time online statusEnter the amount you wish to purchase Input your desired crypto amount, and the system will automatically calculate and display the exact payable amount in ARS.Complete the payment via Mercadopago Transfer the displayed amount using Mercadopago, following the bank details provided by the selected merchant.Confirm payment and notify the seller Click “Transferred, Notify Seller” after completing the transfer. The seller will then verify your payment and promptly release the cryptocurrency to your WEEX account.Your Crypto will arrive instantly in your WEEX wallet — safe, fast, and with zero fees.
Frequently Asked Questions (FAQ)
Q1: Are there any fees when paying with Mercadopago? A: 0% fee for buyers. Only sellers pay a small fee.
Q2: How fast will I receive Crypto? A: Usually 1–5 minutes after marking payment as sent.
Q3: Is buying with Mercadopago safe on WEEX? A: Yes. All trades use official escrow.
Q4: Do I need full KYC? A: Basic KYC is required for P2P trading.
Ready to Buy Crypto with Mercadopago?
Start buying crypto in under 3 minutes — fast, safe, and 0% fee for buyers!
Start Buying Crypto on WEEX P2P with Mercadopago Now!
Conflict Escalates, Oil Prices Moon: How Will Crypto React?
History tells us that geopolitical shocks are often shown as a case of "short-term pain for long-term gain."
Trade here:
CRUDEOIL: Brent Crude (Tokenized)USOON: US Oil (Ondo/Tokenized)XAUT: Tether Gold(Tokenized)The Chaos of the Last Few Days
On February 28, the U.S. and Israel launched a joint military operation codenamed "Epic Fury." A massive airstrike on Iran wiped out core leadership, including Supreme Leader Khamenei. Iran retaliated instantly, moving to choke off the Strait of Hormuz.
There is no secret that the Strait of Hormuz is the world’s most important oil artery, carrying about 20% of global supply. In the world of energy, when the Strait closes, prices go parabolic.
Within just one week: Brent Crude jumped 28% to $92.69; WTI crude skyrocketed 36% to $90.90, marking its biggest weekly gain since 1983.
By March 9, the situation went from bad to worse. A drone strike took out Saudi Arabia's largest refinery, Kuwait slashed production, and Iraq’s daily output dropped by 1.5 million barrels. Oil smashed through the $100 barrier. Iran even upped the ante, warning that if Trump isn't reined in, oil could hit a record-breaking $200.
On March 10, Trump declared that the war was "basically over". Coupled with the G7’s plan to tap into strategic oil reserves and hints from the IRGC about reopening the Strait, these glimmers of hope helped stock markets claw back some losses. Oil began to cool off, with Brent crude retreating to the $85 mark.
By March 11, the time of writing, the International Energy Agency (IEA) proposed the largest emergency oil release in its history, sending Brent crude further down toward $80 per barrel.
The key takeaway: Last week’s "decapitation strike" did not actually rattle oil prices that much. What really sent the market into a tailspin was the realization that Trump’s "quick fix" rhetoric was spinning out of control. That’s when the panic-buying truly began.
Crypto Markets: Dip, Bounce, Dip Again
When the conflict first broke out over the weekend, Bitcoin did what it always does in a crisis — panicked first, recovered second. The whipsaw has been covered in detail in "US-Iran Tensions Boil Over: How War Rewires the Crypto Market".
Then came the plot twist. Instead of winding down after the targeted strikes, the Middle East conflict escalated further, forcing Trump to admit the military operation would drag on for 4 to 5 weeks. Markets took one look at that headline and sold off again.
This "dip to bounce to dip" pattern is practically a playbook at this point. Every major geopolitical shock runs the same script.
Here is a cruel truth regarding Bitcoin: it would not be trade like gold. It trades like a leveraged bet on dollar liquidity.
The "digital gold" narrative has stuck around for years, but when real chaos hits, Bitcoin's first instinct is pure risk-off panic, instead of safety. This also happened on March 12, 2020, with COVID fear wiping out 50% in a day, and on August 5, 2024 while the JPY carrying trade unwinds, Bitcoin cratered alongside the Nasdaq.
Same story this time. On February 28th, as the conflict erupted, Bitcoin flash-crashed toward $63,000. Weekend + war headlines = no liquidity with maximum fear.
The short-term read: War is noisy. Between Trump's contradictory statements, shifting military objectives, and oil supply headlines dropping every few hours, calling the next move is mostly a coin flip. What is predictable: volatility stays elevated. Buckle up.
On the macro side, the market currently anticipates a 97.4% probability that the Federal Reserve will maintain interest rates unchanged in March, with the timing of the first rate cut in 2026 now delayed from the initial expectation of March to the latter half of the year. High oil would lead to sticky inflation, causing the Fed to hold the rate remain. That is a tough environment for Bitcoin as well as other cryptos.
Opportunity in Crisis
While many observers are focusing on painting a doomsday scenario, yet the clues noted are less gloomy..
The first note would be Bitcoin’s drawdown, which is holding up much better than most would have expected.
The relevant observations have already been detailed in WEEX's previous article, US-Iran Tensions Boil Over: How War Rewires the Crypto Market, without further elaboration.
Second, how will the market price change once the dust settles?
History shows that while Bitcoin’s gut reaction to geopolitical shocks is usually a wave of forced liquidations, its long-term trajectory almost always runs counter to that initial panic. In a nutshell, the "dump-then-pump" logic remains undefeated.
Third, what if the war continues?
If the conflict in the Middle East becomes a prolonged affair, the focus will shift to the duration and intensity of the hostilities, as well as the actual recovery of shipping through the Strait of Hormuz. Crucially, if the global economy takes a significant hit, it would pave the way for the Fed to pivot toward more dovish monetary policies—which, ironically, would be a massive tailwind for Bitcoin.
This is the "counter-intuitive" bull case that Arthur Hayes recently highlighted. It is a complex domino effect with plenty of "if", but history proves that it has been a path the market traveled before.
The Future of On-Chain Narratives
Every upheaval in the established order presents a prime opportunity for decentralised assets to demonstrate their worth.
Interestingly, the biggest winner of this conflict is not Bitcoin, but stablecoins and RWA (Real World Assets).
During wartime, straits are alternately blockaded and opened. Nations impose price controls or deliberate on releasing oil reserves. Ordinary citizens bought gold and crude oil, or began transferring assets.
This is where stablecoins and on-chain protocols prove their worth. Their value is simple but profound: Permissionless, Trustless, Borderless, and 24/7.
Ultimately, this Middle East conflict has emphasised the dual nature of crypto. Bitcoin remains a high-beta play that swings with global liquidity. However, stablecoins and RWAs have proven themselves to be the Pragmatic Tools of Decentralization in times of chaos.
At this stage, "cautious optimism" beats "blind pessimism". After all, markets eventually stop pricing in the fear itself and start pricing in the recovery.
What is the Funding Rate and Why Funding Rate Matters?
If you've traded perpetual futures on WEEX, you've encountered the funding rate—a recurring fee between long and short traders. It keeps the contract price aligned with the spot market.
When the rate is positive, longs pay shorts. When negative, shorts pay longs. This mechanism prevents price drift and balances market sentiment.
Understanding funding rates helps you manage costs, gauge market mood, and trade smarter—whether on WEEX or elsewhere.
How Does the Funding Rate Work?Understanding how funding rate works is essential for anyone trading perpetual futures. In perpetual contracts, the contract price often deviates from the spot price. When this happens, the funding rate mechanism kicks in to restore balance.
Positive Funding RateWhen the contract price is higher than the spot price, the funding rate is positive. In this scenario:
Long position holders pay a funding fee to short position holdersThis incentivizes traders to take short positions or close longsThe selling pressure pushes the contract price closer to the spot priceNegative Funding RateWhen the contract price is lower than the spot price, the funding rate is negative. Here's what happens:
Short position holders pay the funding fee to long position holdersThis encourages buying activity and short coveringThe buying pressure pulls the contract price back up toward the spot priceThis fee mechanism keeps perpetual contract prices aligned with the actual market price, preventing the kind of wild divergences that could make futures trading purely speculative.
How to Check the Funding Rate on WEEX ExchangeIf you're trading on WEEX, checking the current funding rate is straightforward. The perpetual contract interface shows:
The current funding rate value for each trading pairA countdown timer to the next funding rate settlementHistorical funding rate data for analysisTo find detailed records of funding rates you've paid or received:
Navigate to [Assets] in your WEEX accountSelect Contract [Bill]Look for "Funds cost" or funding rate entriesThis transparency helps you track exactly how much the funding rate is impacting your trading P&L.
How Does the Funding Rate Impact Trading Strategies?The funding rate directly affects trading costs and can significantly influence your strategy, especially for positions held over multiple settlement periods.
For Long TradersIf the funding rate stays positive over extended periods:
Long traders face higher holding costsConsider reducing leverage or shortening holding timeHigh positive rates can signal overheated bullish sentimentFor Short TradersIf the funding rate stays negative:
Short traders pay fees to longsPersistent negative rates may indicate strong bearish pressureFactor these costs into your risk calculationsWhy Funding Rates Matter for TradersThe significance of what funding rate is goes beyond just a tiny transaction fee. These rates play a pivotal role in the crypto trading ecosystem.
Price ParityFunding rates ensure that perpetual futures prices stay aligned with spot prices, preventing wild discrepancies that could distort the market.
Market Sentiment IndicatorA consistently positive funding rate often signals bullish sentiment, with more traders betting on rising prices. A negative rate might hint at bearish outlooks. Monitoring these rates gives you insight into crowd psychology.
Cost ManagementFor positions held across multiple settlement periods, funding rates can significantly impact profitability. Understanding them helps you decide when to enter, adjust, or exit positions based on both cost and market conditions.
Incentive MechanismWhen prices drift apart, higher funding rates encourage traders to take positions that help restore equilibrium. It's the market's way of self-correcting.
How to Use Funding Rates in Your Trading StrategyLet's talk practical strategy. Knowing what funding rate is and how it behaves can directly influence your trading decisions.
Monitor Funding Rate TrendsBefore entering a position, check the current funding rate and its recent history. Extremely high rates often precede reversals as traders adjust to avoid costs.
Time Your Entries and ExitsConsider timing your trades around funding settlement periods. Entering a short position just before a high positive rate payment could earn you fees rather than paying them.
Final ThoughtsUnderstanding funding rates isn't just technical knowledge—it's a practical tool for smarter trading. Whether on WEEX or elsewhere, funding rates directly impact your P&L, especially for positions held across multiple settlements.
Monitoring them gives you insight into market sentiment, helps manage costs, and can even reveal arbitrage opportunities. Extreme rates often signal crowded trades and potential reversals, giving you an edge in timing entries and exits.
They're neither good nor bad—just a mechanism that keeps futures markets functioning. The key is understanding them and factoring them into your decisions.
Ready to put this knowledge into practice? WEEX offers transparent funding rate displays, user-friendly futures trading, and a 20 USDT welcome bonus for new users. Register on WEEX Now and Start Trading Futures
FAQQ1: What is funding rate in crypto futures?A: The funding rate is a periodic fee exchanged between long and short traders in perpetual futures markets. It keeps the contract price aligned with the spot price.
Q2: How is the funding rate calculated?A: The funding rate is based on two components: the interest rate (a small stable percentage) and the premium index (which measures price deviation between futures and spot).
Q3: When is funding rate charged on WEEX?A: On WEEX, funding is settled at 00:00, 08:00, and 16:00 UTC (07:00, 15:00, 23:00 UTC+8).
Q4: Do I pay funding rate if I hold a position for less than 8 hours?A: If you close your position before a settlement time, you won't pay or receive funding for that period. Funding only applies to positions held through settlement.
Cold Wallet 2026: What Is a Crypto Cold Wallet and How Does It Work?
The rapid growth of cryptocurrency adoption has made secure storage a major concern for investors in 2026. With high-profile exchange failures and increasingly sophisticated hacking attempts, protecting digital assets has never been more critical. Many users now move part of their assets into cold wallets to reduce the risk of hacks and exchange failures.
Understanding how cold wallets work is essential before deciding whether to store crypto offline. This guide covers everything you need to know about crypto cold wallets, from basic concepts to practical security considerations.
What Is a Cold Wallet for Crypto?A cold wallet is a cryptocurrency storage method where private keys are kept offline instead of on an internet-connected device. Private keys are the credentials that prove ownership of digital assets such as Bitcoin, Ethereum, or other tokens. Because they remain disconnected from the internet, cold wallets significantly reduce exposure to hacking attempts.
In practice, a cold wallet isolates sensitive information from online systems. Even if a user's computer becomes infected with malware, the private keys stored offline cannot be accessed remotely. For this reason, long-term investors, institutions, and crypto funds frequently use cold storage to protect large holdings.
The fundamental principle is simple: if your private keys never touch the internet, they cannot be stolen through online attacks. This makes cold wallets the gold standard for securing cryptocurrency.
How Does a Crypto Cold Wallet Work?Understanding how a cold wallet works is crucial for anyone serious about crypto security. A cold wallet generates and stores private keys in an environment that is not connected to the internet. When a user wants to send cryptocurrency, a transaction is created on an online device but signed on the offline device holding the keys.
The simplified process usually looks like this:
A transaction is prepared on an online device (like a computer or phone)The unsigned transaction is transferred to the cold wallet (via USB, QR code, or manual entry)The cold wallet signs the transaction using the private key stored offlineThe signed transaction is returned to an online device and broadcast to the blockchainBecause the signing step occurs offline, attackers cannot steal the private keys through the internet. This air-gapped approach ensures that even if your online device is compromised, your funds remain secure.
Types of Crypto Cold WalletsThere are several forms of cold wallets available today. Each offers different levels of convenience and security, allowing users to choose based on their specific needs and technical comfort.
Hardware WalletsHardware wallets are physical devices built specifically to protect crypto private keys. They are the most popular type of cold wallet for individual investors in 2026. These devices typically connect through USB or use QR codes and include built-in screens that allow users to verify transactions securely.
Many modern devices also include secure chips, PIN codes, and recovery seed phrases. These features protect assets even if the wallet device is lost or stolen. Leading examples include Ledger and Trezor, which have become household names in the crypto security space.
Hardware wallets strike an excellent balance between security and usability, making them the recommended choice for most long-term holders.
Offline Software WalletsOffline software wallets operate on computers that are permanently disconnected from the internet. This setup is sometimes called an air-gapped wallet. A dedicated laptop or computer is used exclusively for generating and signing transactions, with no network connectivity.
While secure, this approach requires more technical knowledge and careful operational procedures. It is usually preferred by advanced users or institutions with significant technical resources.
Paper WalletsA paper wallet is simply a printed private key or QR code stored physically. It was one of the earliest forms of cold storage and remains conceptually simple. Users generate a key pair on an offline computer, print the keys, and store the paper securely.
However, paper wallets are now considered risky because they can easily be destroyed, stolen, or misplaced. Many modern security guides discourage their use in favor of more robust solutions like hardware wallets.
Metal WalletsMetal wallets store seed phrases engraved on durable metal plates. These are primarily used as backups rather than active wallets. They are resistant to fire, water damage, and physical wear, which makes them useful for long-term recovery storage.
A metal wallet doesn't store your crypto directly but protects the recovery phrase needed to restore your funds if your primary wallet is lost or damaged.
Sound WalletsSound wallets encode private keys as audio files stored on physical media such as USB drives or discs. While innovative, they are rarely used in practice and require specialized tools to decode. This approach remains largely experimental.
Should I Put My Crypto Assets in a Cold Wallet?Whether to use a cold wallet depends largely on how you manage your cryptocurrency. Investors who hold assets long term often store a large percentage of their holdings offline.
Cold wallets are especially useful when:
Holding large amounts of crypto—the more you have, the more you stand to lose in a hackStoring assets for months or years—long-term holdings don't need frequent accessProtecting funds from exchange risks—cold storage eliminates counterparty riskHowever, traders who move assets frequently may still rely on hot wallets for convenience. A common strategy is to keep small trading balances in hot wallets while storing the majority of long-term holdings in cold storage.
Is a Cold Wallet 100% Safe?Cold wallets are among the safest crypto storage methods, but they are not completely risk-free. Their main advantage is protection from online attacks, which are the most common form of crypto theft. When implemented correctly, cold storage makes remote hacking virtually impossible.
However, offline storage introduces other risks that users must understand:
Losing the recovery phrase—if your seed phrase is lost, your funds are gone foreverPhysical damage—fire, water, or simple wear can destroy a hardware walletTheft—if someone steals your wallet and knows your PIN, funds could be at riskHuman error—mistakes in transaction signing or backup procedures can lead to lossSecurity experts generally recommend a layered approach. Many investors keep smaller trading balances in hot wallets while storing long-term holdings in cold storage. This strategy provides both convenience and security.
Cold Wallet vs Hot WalletUnderstanding the difference between hot wallets and cold wallets is key to smart crypto storage.
Hot wallets stay connected to the internet—think exchange accounts, MetaMask, or mobile apps. They're convenient for daily trades but vulnerable to online attacks.
Cold wallets stay offline. They're less convenient but offer far stronger protection against hackers.
That's why many investors split their funds: keep 5–10% in hot wallets for trading, and store the other 90–95% in cold storage for long-term security. Best of both worlds.
Read More: Hot Wallet vs. Cold Wallet: Which is Better for You?
Final Thoughts: Securing Your Crypto with Cold WalletsAs crypto adoption grows in 2026, so do online risks. Cold wallets offer the strongest protection for serious investors—keeping private keys offline is the core principle.
Yes, they require more care than hot wallets, but the security benefits far outweigh the inconvenience. For long-term holders and significant balances, cold storage isn't just recommended—it's essential.
Ready to start securing your crypto? WEEX offers a secure platform for buying and trading, but remember—for long-term storage, consider moving your assets to a cold wallet. Register on WEEX Now and Start Trading!
FAQQ1: What is a cold wallet in crypto?A: A cold wallet is a cryptocurrency wallet that stores private keys offline, protecting funds from online hacks and malware. It's the most secure way to store crypto for long periods.
Q2: How does a cold wallet work?A: A cold wallet generates and stores private keys offline. Transactions are created online but signed on the offline device, then broadcast to the network. The private keys never touch the internet.
Q3: Is a cold wallet safer than a hot wallet?A: Yes, cold wallets are generally safer because they remain disconnected from the internet, reducing exposure to cyberattacks. Hot wallets offer more convenience but greater risk.
Q4: Do I need a cold wallet for crypto?A: If you hold large amounts of cryptocurrency or plan long-term storage, using a cold wallet can significantly improve security. Small amounts held for trading may be fine in hot wallets.
Buy ETH with OVO on WEEX P2P – 0 Fee & Ultra-Fast IDR Trades
OVO is a top-choice option in Indonesia, offering users a fast and reliable way to buy ETH using IDR. With WEEX P2P, users can buy ETH directly through OVO with zero fees, access 24/7 verified merchants, and enjoy ultra-fast release times.
Compared with Binance, Bybit, and local OTC platforms, WEEX consistently offers better IDR exchange rates, safer escrow protection, and more available ads for OVO users.
With ETH adoption rising across Indonesia, reliable and fast access to digital assets has turned into a key requirement for users. With WEEX P2P, users can buy USDT, BTC, or ETH via OVO with instant processing, 0% buyer fees, and professional merchant support.
What is P2P Trading?
Peer-to-Peer (P2P) trading allows users to buy and sell ETH directly with other users, while the platform acts as a secure intermediary.
On WEEX P2P:
ETH is held in escrowSellers release assets only after payment is confirmedTrades are processed quickly and safelyThis ensures zero counterparty risk and allows users to pay via local banking methods for a seamless experience.
Why WEEX P2P is the Best Choice for OVO Users
WEEX P2P offers key advantages to users purchasing ETH with IDR via OVO:
0% fee for buyers (save 2-8% vs competitors)Fast release times (1–3 minutes on average)Official escrow protection – 100% safeSupport from small amounts to large-volume tradesBest IDR exchange rates for OVO usersThousands of merchants online 24/7More OVO ads than any competing platformWhether you’re buying 1,000 IDR or 1,000,000 IDR, WEEX ensures fast, safe, and cost-efficient ETH purchases.
How to Buy ETH with OVO on WEEX P2P
Buying ETH with OVO on WEEX is simple and fast. Follow these steps:
Register on WEEX and complete basic KYC Takes less than 1 minute.Go to Buy ETH → P2P Trading Select IDR as your fiat currency.Filter by “OVO” You will now only see advertisements that support OVO transfers.Select the best merchant Compare based on:PriceCompletion rateVolumeOnline statusEnter the amount you want to buy The system will show your exact cost in IDR.Make the payment via OVO Transfer the amount shown using the merchant’s bank details.Tap “Transferred, Notify Seller” The seller will verify your payment and release ETH.Your ETHC will arrive instantly in your WEEX wallet — safe, fast, and with zero fees.
Frequently Asked Questions (FAQ)
Q1: Are there any fees when paying with OVO? A: 0% fee for buyers. Only sellers pay a small fee.
Q2: How fast will I receive ETH? A: Usually 1–5 minutes after marking payment as sent.
Q3: Is buying with OVO safe on WEEX? A: Yes. All trades use official escrow.
Q4: Do I need full KYC? A: Basic KYC is required for P2P trading.
Ready to Buy ETHC with OVO?
Start buying ETH in under 3 minutes — fast, safe, and 0% fee for buyers!
Start Buying ETH on WEEX P2P with OVO Now!
Buy USDC with OVO on WEEX P2P – 0 Fee & Ultra-Fast IDR Trades
OVO is a top-choice option in Indonesia, offering users a fast and reliable way to buy USDC using IDR. With WEEX P2P, users can buy USDC directly through OVO with zero fees, access 24/7 verified merchants, and enjoy ultra-fast release times.
Compared with Binance, Bybit, and local OTC platforms, WEEX consistently offers better IDR exchange rates, safer escrow protection, and more available ads for OVO users.
With USDC adoption rising across Indonesia, reliable and fast access to digital assets has turned into a key requirement for users. With WEEX P2P, users can buy USDT, BTC, or ETH via OVO with instant processing, 0% buyer fees, and professional merchant support.
What is P2P Trading?
Peer-to-Peer (P2P) trading allows users to buy and sell USDC directly with other users, while the platform acts as a secure intermediary.
On WEEX P2P:
USDC is held in escrowSellers release assets only after payment is confirmedTrades are processed quickly and safelyThis ensures zero counterparty risk and allows users to pay via local banking methods for a seamless experience.
Why WEEX P2P is the Best Choice for OVO Users
WEEX P2P offers key advantages to users purchasing USDC with IDR via OVO:
0% fee for buyers (save 2-8% vs competitors)Fast release times (1–3 minutes on average)Official escrow protection – 100% safeSupport from small amounts to large-volume tradesBest IDR exchange rates for OVO usersThousands of merchants online 24/7More OVO ads than any competing platformWhether you’re buying 1,000 IDR or 1,000,000 IDR, WEEX ensures fast, safe, and cost-efficient USDC purchases.
How to Buy USDC with OVO on WEEX P2P
Buying USDC with OVO on WEEX is simple and fast. Follow these steps:
Register on WEEX and complete basic KYC Takes less than 1 minute.Go to Buy USDC → P2P Trading Select IDR as your fiat currency.Filter by “OVO” You will now only see advertisements that support OVO transfers.Select the best merchant Compare based on:PriceCompletion rateVolumeOnline statusEnter the amount you want to buy The system will show your exact cost in IDR.Make the payment via OVO Transfer the amount shown using the merchant’s bank details.Tap “Transferred, Notify Seller” The seller will verify your payment and release USDC.Your USDCC will arrive instantly in your WEEX wallet — safe, fast, and with zero fees.
Frequently Asked Questions (FAQ)
Q1: Are there any fees when paying with OVO? A: 0% fee for buyers. Only sellers pay a small fee.
Q2: How fast will I receive USDC? A: Usually 1–5 minutes after marking payment as sent.
Q3: Is buying with OVO safe on WEEX? A: Yes. All trades use official escrow.
Q4: Do I need full KYC? A: Basic KYC is required for P2P trading.
Ready to Buy USDCC with OVO?
Start buying USDC in under 3 minutes — fast, safe, and 0% fee for buyers!
Start Buying USDC on WEEX P2P with OVO Now!
Buy USDT with OVO on WEEX P2P – 0 Fee & Ultra-Fast IDR Trades
OVO is a top-choice option in Indonesia, offering users a fast and reliable way to buy crypto using IDR. With WEEX P2P, users can buy crypto directly through OVO with zero fees, access 24/7 verified merchants, and enjoy ultra-fast release times.
Compared with Binance, Bybit, and local OTC platforms, WEEX consistently offers better IDR exchange rates, safer escrow protection, and more available ads for OVO users.
With crypto adoption rising across Indonesia, reliable and fast access to digital assets has turned into a key requirement for users. With WEEX P2P, users can buy USDT, BTC, or ETH via OVO with instant processing, 0% buyer fees, and professional merchant support.
What is P2P Trading?
Peer-to-Peer (P2P) trading allows users to buy and sell crypto directly with other users, while the platform acts as a secure intermediary.
On WEEX P2P:
Crypto is held in escrowSellers release assets only after payment is confirmedTrades are processed quickly and safelyThis ensures zero counterparty risk and allows users to pay via local banking methods for a seamless experience.
Why WEEX P2P is the Best Choice for OVO Users
WEEX P2P offers key advantages to users purchasing crypto with IDR via OVO:
0% fee for buyers (save 2-8% vs competitors)Fast release times (1–3 minutes on average)Official escrow protection – 100% safeSupport from small amounts to large-volume tradesBest IDR exchange rates for OVO usersThousands of merchants online 24/7More OVO ads than any competing platformWhether you’re buying 1,000 IDR or 1,000,000 IDR, WEEX ensures fast, safe, and cost-efficient crypto purchases.
How to Buy Crypto with OVO on WEEX P2P
Buying crypto with OVO on WEEX is simple and fast. Follow these steps:
Register on WEEX and complete basic KYC Takes less than 1 minute.Go to Buy Crypto → P2P Trading Select IDR as your fiat currency.Filter by “OVO” You will now only see advertisements that support OVO transfers.Select the best merchant Compare based on:PriceCompletion rateVolumeOnline statusEnter the amount you want to buy The system will show your exact cost in IDR.Make the payment via OVO Transfer the amount shown using the merchant’s bank details.Tap “Transferred, Notify Seller” The seller will verify your payment and release crypto.Your Crypto will arrive instantly in your WEEX wallet — safe, fast, and with zero fees.
Frequently Asked Questions (FAQ)
Q1: Are there any fees when paying with OVO? A: 0% fee for buyers. Only sellers pay a small fee.
Q2: How fast will I receive Crypto? A: Usually 1–5 minutes after marking payment as sent.
Q3: Is buying with OVO safe on WEEX? A: Yes. All trades use official escrow.
Q4: Do I need full KYC? A: Basic KYC is required for P2P trading.
Ready to Buy Crypto with OVO?
Start buying crypto in under 3 minutes — fast, safe, and 0% fee for buyers!
Start Buying Crypto on WEEX P2P with OVO Now!