- Kup krypto
- Rynki
- Kontrakty futures
- Spot
- Copy trading
 WE-Launch
On-chain Data Academy (Part 1): Do you know what the average market-wide BTC cost is?
Original Article Title: "On-Chain Data School (Part 1): Do You Know What the Market-Wide BTC Average Cost Is?"
Original Article Author: Mr. Berg, On-Chain Data Analyst
TLDR
· This article will introduce "one on-chain analysis concept" and "three on-chain data points"
· MVRV represents the market-wide profit state
· Realized Price represents the average cost of holding BTC for the entire market
· Realized Cap can be thought of as "how much money the market collectively spent to buy BTC"
What Is Realized Cap?
Realized Cap, also known as Realized Market Cap, refers to "multiplying each unit of BTC by the price at the last transfer, and then summing them up".
In simple terms: Each transfer can be seen as a "transaction", so multiplying the corresponding amount of BTC by the price at the last transfer is equivalent to the cost of that transaction. Adding up these costs gives you the Realized Cap.
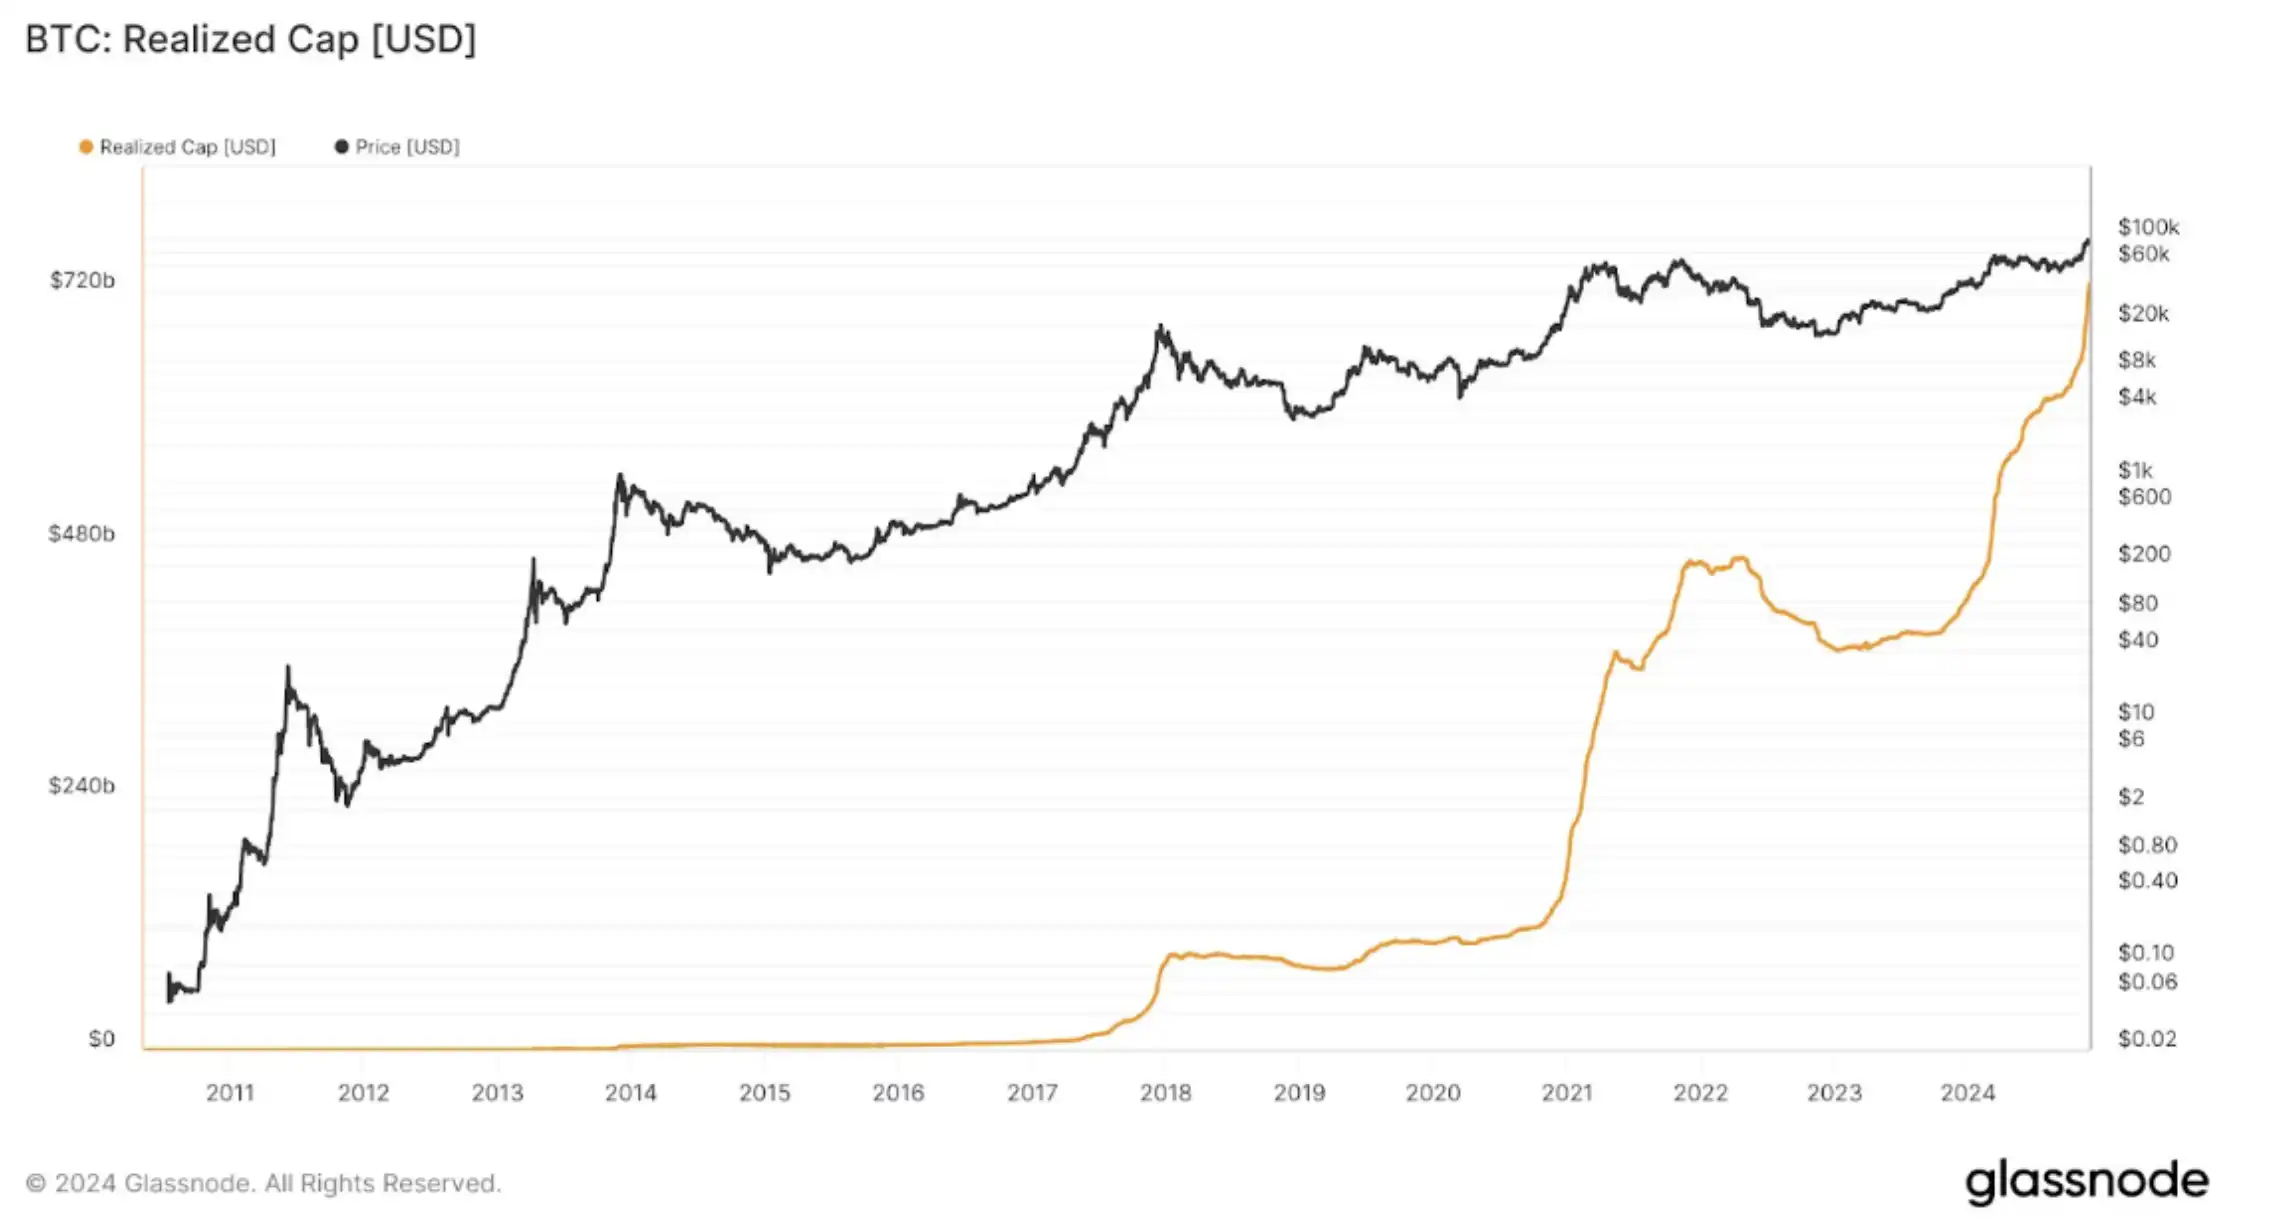
Realized Cap Chart
What Is Realized Price?
Realized Price (RP), also known as Realized Price, is the number obtained by dividing "Realized Cap by the current BTC circulating supply".
We can interpret this as: "Total cost of BTC purchased by the whole market / How many BTC were purchased".
In other words, this is the "average cost of BTC for the entire market". By the way, it's always a good buying opportunity when the price is below RP!

Realized Price Chart

(Price Below Realized Price)
What Is MVRV?
MVRV, short for MV divided by RV, represents the market's profitability status.
MV refers to the current BTC market value, i.e., "market price x circulating supply"; while RV is Realized Cap.
Moreover, if both the numerator and denominator of the formula are divided by the circulating supply, MVRV can also be expressed as "market price / RP." For example: if MVRV = 2, it represents an average market profitability of 100%.

MVRV Chart
Summary
The above is all the content of On-Chain Data School (Part One). For readers interested in delving deeper into on-chain data analysis, remember to track this series of articles!
If you want to see more analysis and educational content on on-chain data, feel free to follow my Twitter (X) account!
Hope this article has been helpful to you. Thank you for reading.
Możesz również polubić
Zyskujące
Najnowsze wiadomości kryptowalutowe
Alliance DAO Genesis: Trudno się przekonać, aby trzymać token L1 w dłuższej perspektywie, ponieważ nie ma "Moat".
Przegląd aktywności na łańcuchu wieloryba: 'Buddy' dodaje do długiej pozycji, whale nets ponad 10 milionów dolarów w zysku shorting 1000 BTC
YZi Labs przedstawiła projekt oświadczenia rejestracyjnego do SEC USA, mając na celu rozszerzenie zarządu CEA Industries i wybór nowych dyrektorów.
24-godzinna tabela wyników fluktuacji lokalizacji: Przepływ netto BTC wynosił 473 mln USD, a przepływ netto ETH 33,22 mln USD
Wieloryb zakończył prawie 3-letnią hibernację, sprzedając 200 BTC.
Obsługa klienta:@weikecs
Współpraca biznesowa:@weikecs
Quant trading i MM:[email protected]
Usługi VIP:[email protected]