- Купити крипту
- Ринок
- Ф’ючерси
- Спот
- Копітрейдинг
 WE-Launch
On-chain Data Academy (Part 1): Do you know what the average market-wide BTC cost is?
Original Article Title: "On-Chain Data School (Part 1): Do You Know What the Market-Wide BTC Average Cost Is?"
Original Article Author: Mr. Berg, On-Chain Data Analyst
TLDR
· This article will introduce "one on-chain analysis concept" and "three on-chain data points"
· MVRV represents the market-wide profit state
· Realized Price represents the average cost of holding BTC for the entire market
· Realized Cap can be thought of as "how much money the market collectively spent to buy BTC"
What Is Realized Cap?
Realized Cap, also known as Realized Market Cap, refers to "multiplying each unit of BTC by the price at the last transfer, and then summing them up".
In simple terms: Each transfer can be seen as a "transaction", so multiplying the corresponding amount of BTC by the price at the last transfer is equivalent to the cost of that transaction. Adding up these costs gives you the Realized Cap.
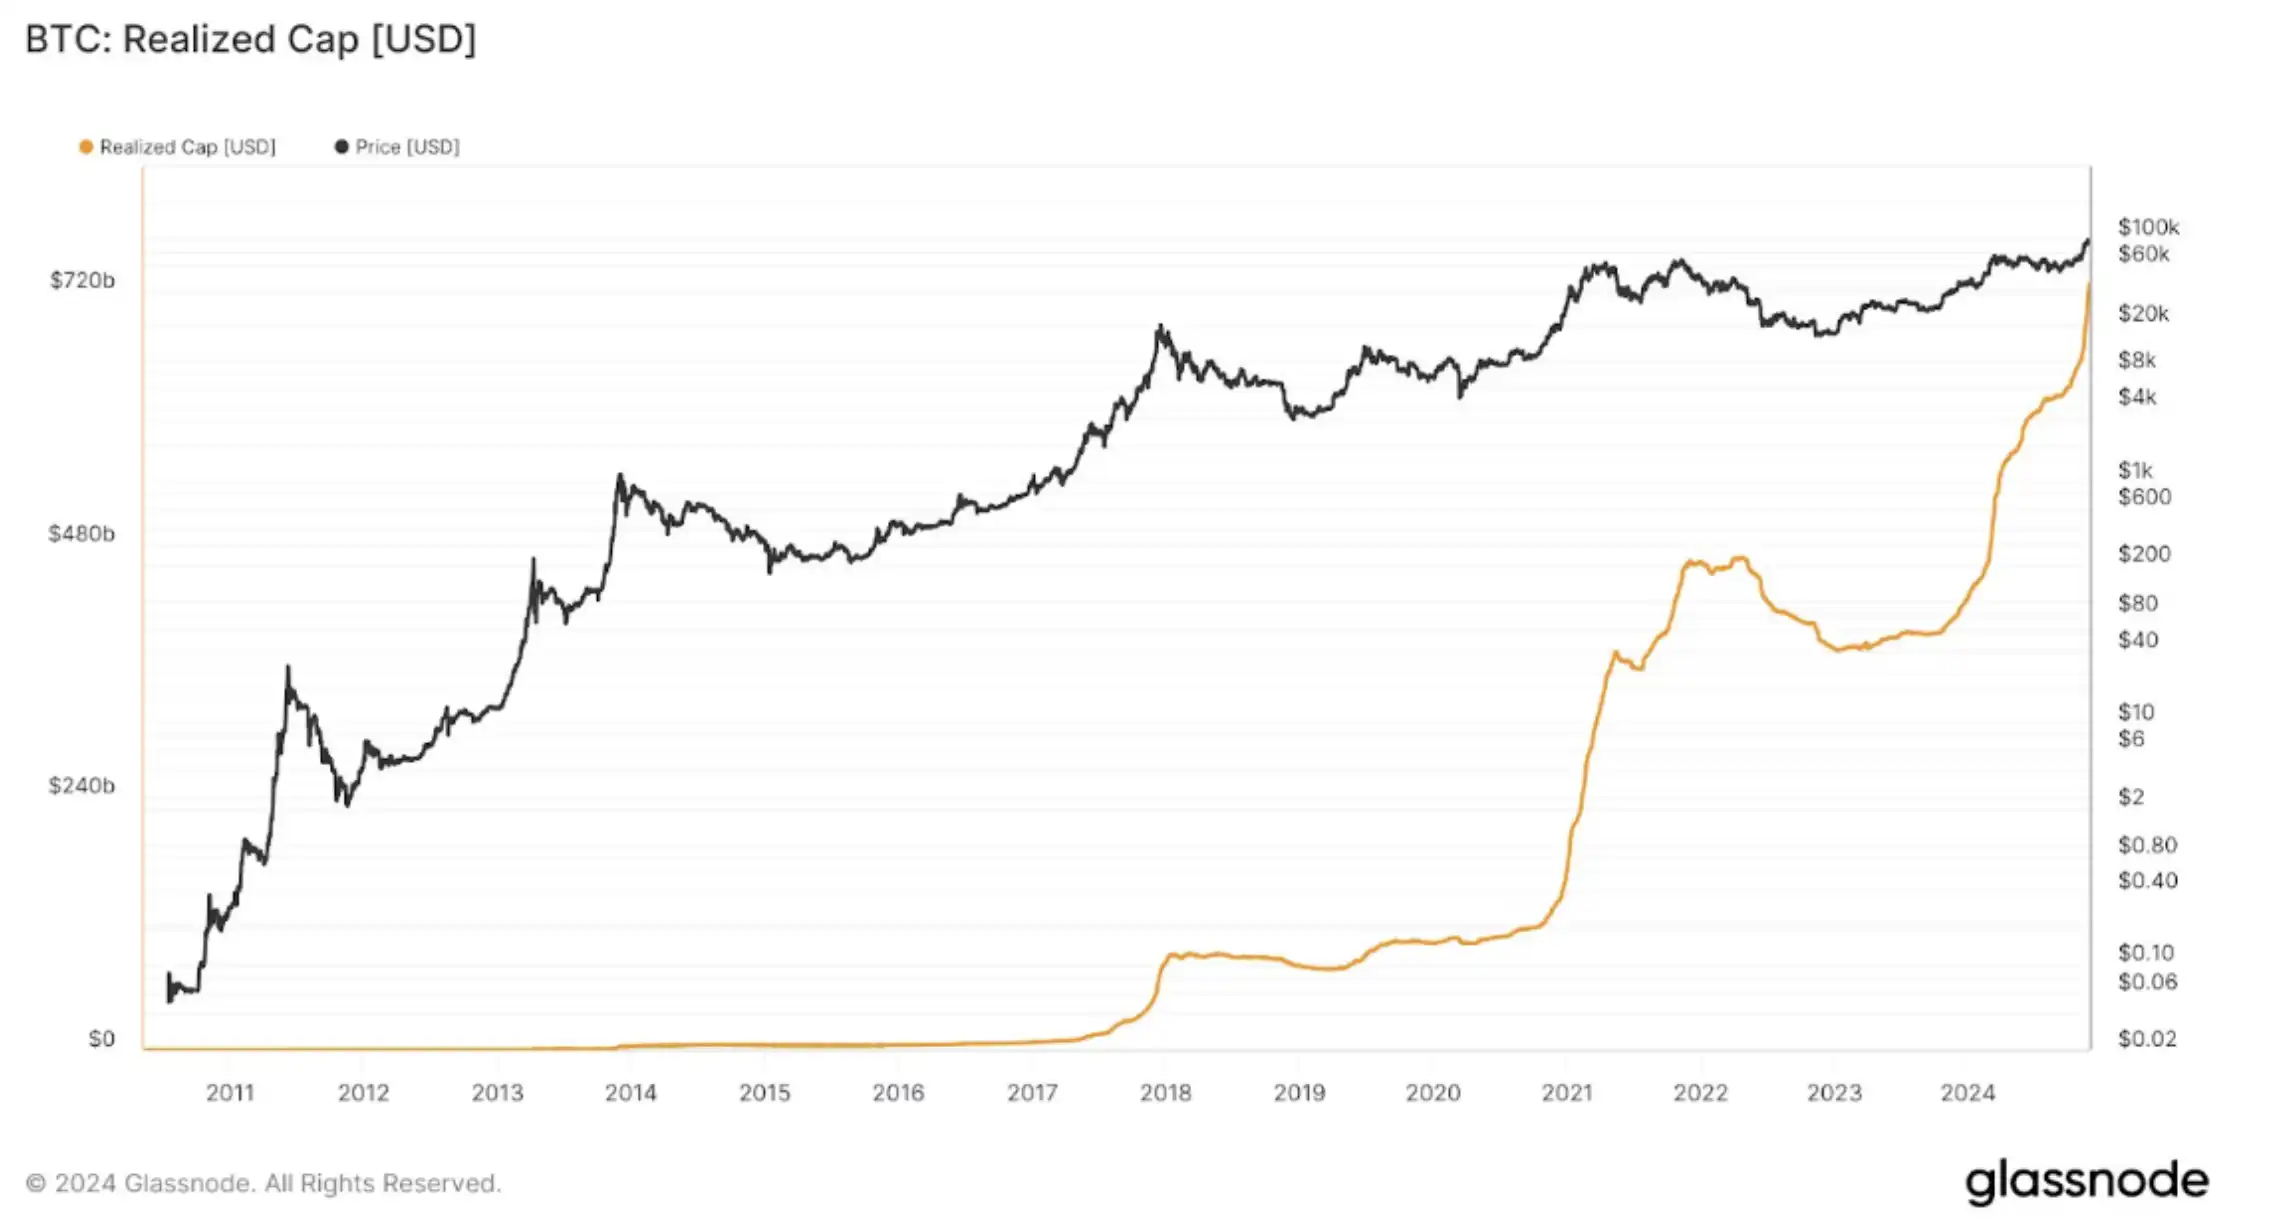
Realized Cap Chart
What Is Realized Price?
Realized Price (RP), also known as Realized Price, is the number obtained by dividing "Realized Cap by the current BTC circulating supply".
We can interpret this as: "Total cost of BTC purchased by the whole market / How many BTC were purchased".
In other words, this is the "average cost of BTC for the entire market". By the way, it's always a good buying opportunity when the price is below RP!

Realized Price Chart

(Price Below Realized Price)
What Is MVRV?
MVRV, short for MV divided by RV, represents the market's profitability status.
MV refers to the current BTC market value, i.e., "market price x circulating supply"; while RV is Realized Cap.
Moreover, if both the numerator and denominator of the formula are divided by the circulating supply, MVRV can also be expressed as "market price / RP." For example: if MVRV = 2, it represents an average market profitability of 100%.

MVRV Chart
Summary
The above is all the content of On-Chain Data School (Part One). For readers interested in delving deeper into on-chain data analysis, remember to track this series of articles!
If you want to see more analysis and educational content on on-chain data, feel free to follow my Twitter (X) account!
Hope this article has been helpful to you. Thank you for reading.
Вам також може сподобатися
Лідери росту
Останні новини криптовалют
Генезис Альянсу DAO: Важко переконати себе тримати токен L1 довгостроково, оскільки немає жодного «рову».
Огляд активності китів у мережі: «Buddy» додає до довгої позиції, Whale отримує понад 10 мільйонів доларів прибутку, продаючи 1000 BTC на шортінг
Компанія YZi Labs подала до Комісії з цінних паперів і бірж США проєкт реєстраційної заяви, маючи намір розширити раду директорів CEA Industries та обрати нових директорів.
24-годинна таблиця лідерів потоку спотового фінансування: Чистий приплив BTC склав 473 мільйони доларів, чистий відтік ETH - 33,22 мільйона доларів
Кит завершив майже 3-річну сплячку, продавши 200 BTC.
Підтримка клієнтів:@weikecs
Співпраця:@weikecs
Кількісна торгівля та маркетмейкінг:[email protected]
VIP-послуги:[email protected]