
Value Coin: A Rebirth in Desperation, Who Is Really Profiting from All This Infrastructure? | Financial Mirror
Infrastructure seems to be an eternal topic for Crypto.
Although Infra is not as directly face-to-face with users as DeFi and other applications, it can always get the support of top institutions behind the scenes. From Crypto Native to Old Money, starting a business with infrastructure as a support seems to have become a "stable" business. The track is stable, the model is identifiable, and you can collect rent while lying down, and you can make a profit without losing money. Believers in technology and resource tycoons do not seem to want to get involved in high-risk Mass Adoption. More and more high FDV projects are emerging like factory copy and paste.
In the end, the speculators' 100-fold dream and the valuation bubble of the project were ruthlessly punctured by the market. VC coins became a street rat that everyone shouted and beat overnight, and endless infrastructure brought the ultimate question to the industry: Do we really need so much infrastructure? With this question, this article selects mainstream projects in the field of Crypto infrastructure as representatives to analyze their operating conditions, giving readers a perspective to judge whether the current market infrastructure should be cleared.
BlockBeats Note: There is no clear regulation in the Crypto market, so unlike traditional listed companies, the project party is not obliged to fully disclose its specific performance. Among them, the project party's income sources include wallet transfers, off-chain income, and token sales. Therefore, this article will use the publicly disclosed on-chain data that can be collected as the main reference and evaluation basis.
Oracle
Oracles can not only be used in Crypto to provide quotes for various dapps and fill the information gap between on-chain and off-chain, but also serve traditional financial products such as bonds and credit default swaps. At the same time, in Crypto where regulatory compliance has not yet been fully followed up, we cannot obtain the complete revenue situation after third-party audits through existing channels, and only obtain data through public channels on the chain for analysis.
In the oracle track, TVS (Total Value Secured) is usually used as a key measurement indicator. According to DefiLlama data, Chanlink still maintains its kingly style, with a market share of 44% in the total TVS, which is monopolistic. The TVS market share of the other top 5 protocols is WINKlink (15%), Chronicle (13.59%), Pyth (8.95%), and Swithboard (3.88%). However, WNLink and Chronicle are mainly used in the TRON ecosystem and MakerDAO respectively, and both rely on their own "big trees" for shade and do not have widespread market applications. Therefore, Chainlink and Pyth were selected as the analysis objects in the oracle field.

Oracle TVS share, data source: DefiLlama
Chainlink
As a veteran oracle project, Chainlink's main businesses include data feeds, CCIP, VRF, and contract automation (keepers). Its market share has remained at this level since it broke through 40% in 2020, and it has maintained an absolute monopoly in the market. Its business not only covers on-chain, but also includes cooperation with off-chain entities, such as SWIFT and Google Cloud. Chainlink's market application scope and scale are currently unmatched by other oracle protocols or even other infrastructure projects. In terms of specific business share, AAVE V3 accounts for 51% of Chainlink TVS, the largest share and a total TVL of 11.4 billion. The last four are Spark, Venus Core Pool, Compound V3 and Eigenpie.

Chainlink TVL distribution, data source: DefiLlama
According to Dune data, since entering the bear market cycle in September 2022, Chainlink's monthly revenue has remained at around US$4 million. In this cycle, Chainlink's overall on-chain revenue has not returned to the level of the 2021 bull market, barely reaching US$4.7 million at the peak of the small bull market in March this year.
It is worth noting that AAVE, as Chainlink's largest revenue contributor, has repeatedly set new highs in protocol fee revenue this year, and its overall performance is close to the level of the previous bull market. At the same time, since the end of 2023, AAVE's daily active users have continued to grow, and it is not affected even when the market cools down. However, Chainlink's revenue has not been significantly improved as a result.
In terms of revenue share, Ethereum was the only one in the last cycle, contributing more than 60% of revenue. Since the rise of various L2s, Ethereum's phenomenon of being too big to fail in Chainlink has been alleviated, and its share has gradually declined. The share of emerging L2s represented by Optimism and Arbtrium has increased significantly. On the one hand, Chainlink's revenue sources are more dispersed and diversified, but on the other hand, it also reflects the split of ecological liquidity brought about by L2.

Chainlink revenue sources and proportions, data source: Dune
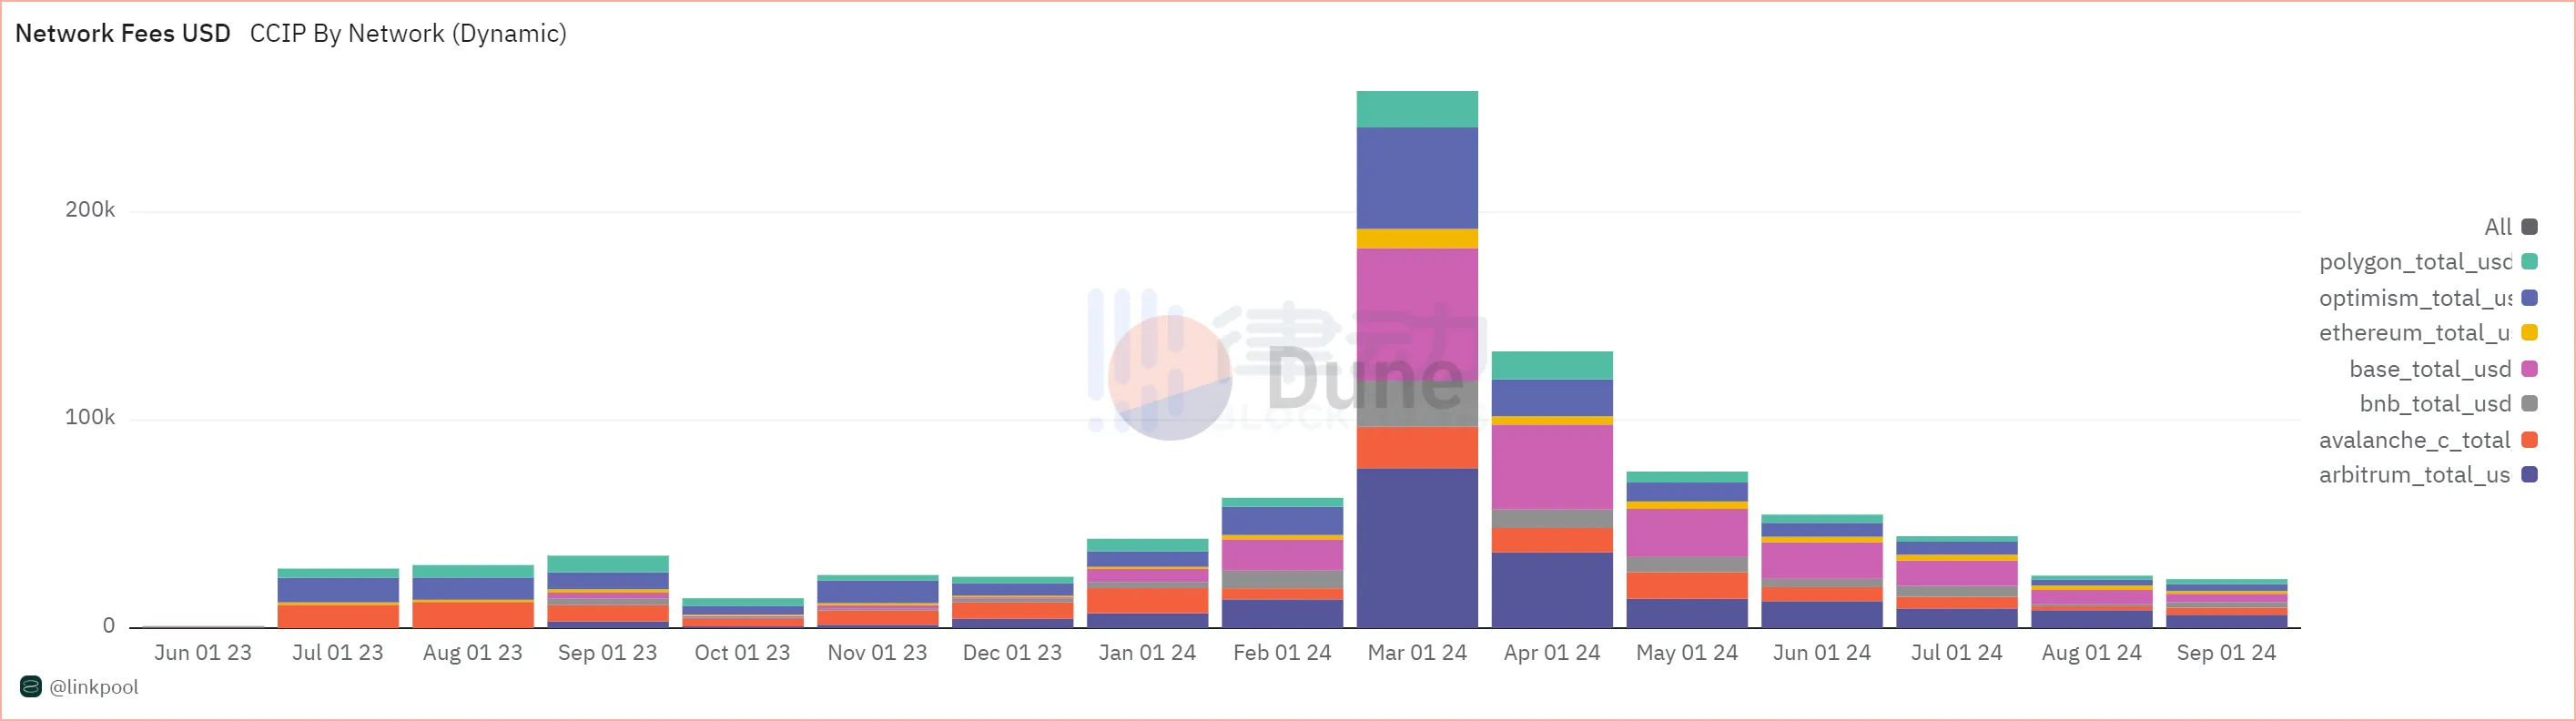
CCIP, as Chainlink's flagship product for entering the cross-chain track, was officially released in July 23. Chainlink supports almost all mainstream public chains and protocols on the market, and at the same time has first-hand data information. CCIP's business integration can be said to be "time, place, and people".
According to Dune data, CCIP uses Cross-chain fees as its main source of business income, and is mainly contributed by mainstream L2s such as Arbitrum, Base, and Optimism. Cross-chain income depends largely on the market's prosperity and is sensitive to market reactions. In March of this year, its cross-chain income peaked at about US$258,000 under the favorable catalysis of the approval of BTC ETF. After the on-chain market cooled, Q2 revenue decreased by 30%, and reached an extreme freezing point in the Q3 market, with revenue falling again by 70% and finally maintaining at $25,000 per month.
Cross-chain fees and sources, data source: Dune
In terms of token performance, its native token $LINK did not have any value capture function before the update, and with the continuous release of node rewards, the micro level will only continue to dilute the price of $LINK. Since the release of Token Economics 2.0 in 2022, the practicality of its tokens has changed, mainly through the staking function of $LINK. In Staking1.0, only the community and node operators are allowed to stake tokens. After the release of version 2.0, not only the scale of staking has been expanded, but also the threshold for staking has been lowered and the unstaking mechanism has been opened. Currently, the circulation of $LINK is about 60%. Although it has not been fully unlocked, the token price of $LINK has performed well in this bull market thanks to its staking mechanism.
Pyth
As a rising star, Pyth Network adopts a "pull" price feeding service that is different from traditional oracles, improving the previous push-type service to on-demand access. DeFi protocols can enjoy Pyth's price feeding service by developing corresponding contracts, saving more time and development costs to polish their own products. With its simple service model and the support of the Solana ecosystem, Pyth has become Solana's largest oracle protocol.
According to DefiLlama data, Pyth's business is concentrated in Kamino Lend, with a TVL of US$1.32 billion, accounting for about 30% of the total TVS. At the same time, Pyth's total TVS is increasing over time. This year's total TVS is more than double the high point in 2022, and its development scale is still expanding.

Pyth TVL(TVS) growth, data source: DefiLlama

Pyth TVL(TVS) distribution, data source: DefiLlama
There is no public information on the market to query Pyth’s income and expenses, so we use the operating data to "see the leopard in the tube" to infer whether Pyth is in good overall condition. Compared with the leader Chainlink, the "dark horse" Pyth has an absolute advantage in the scale of Price Feeds on Solana. On a weekly basis, Chainlink's number of price feed transactions on Solana is far less than Pyth, with an average of less than 1 million transactions per week. Pyth basically maintains above 1 million transactions, accounting for 85% of Solana's total price feed transaction volume. As Pyth's "happy hometown", Solana is its rear base, and it is reasonable. Considering the business scale of the EVM chain, Pyth is in a period of steady growth. After the average weekly transaction number exceeded 100K, it gradually stabilized and mainly used public chains such as Arbitrum, Fantom, and Optimism.

Left: Number of Solana transactions processed by Pyth (compared with Chainlink); Right: Number of transactions processed by Pyth EVM chain and source, data source: Dune
However, Pyth still has a long way to go in the market expansion of the EVM chain. According to Dune data, Chainlink still has an absolute monopoly on a weekly basis, accounting for about 92.7% of the EVMs market share. Although Pyth is developing rapidly, the number of transactions processed by its EVM chain is only a fraction of Chainlink.

Comparison of the number of transactions processed by Pyth and Chainlink EVM chains, data source: Dune
It is worth noting that according to Dune's data, for the entire Crypto market, the largest number of transactions processed by Chainlink comes from Solana, and the number of transactions from EVM accounts for about half of Solana.

Number of weekly transactions processed by Chainlink (Solana VS EVM), data source: Dune
In the context of the oracle track gradually becoming a red ocean market in Crypto, whether from the cost side or from the ecological side, Pyth needs to solve the "WHY YOU" problem for users in order to grab more EVM shares.
From the perspective of token investment, $PYTH's value capture is similar to $LINK, and community voting governance can be carried out through staking. In addition to the staking function, users cannot share the dividends of Pyth's development. At the same time, the total number of $PYTH is 10 billion, and the current circulation is only 36%. After the large-scale unlocking in May and the cold market, the price of $PYTH has been hit hard. It has fallen all the way from the highest of 1.2 to the recent 0.3.
Although Pyth's fundamentals are in full swing, investors in its tokens need to understand whether these businesses are related to the tokens they hold.
Cross-chain interoperability
Since Crypto has formed a multi-chain pattern with Ethereum as the leader and other public chains as the stars, cross-chain has made up for the liquidity dispersion problem caused by the fragmentation of public chains and has become an indispensable part of crypto infrastructure.
In the field of cross-chain interoperability, the three major cross-chain protocols Wormhole, Layerzero and Axeler and cross-chain applications Across and Stargate were selected. This article only analyzes and compares the profitability of cross-chain infrastructure from a financial and operational perspective. However, for cross-chain users, "there are tens of millions of public chains, and safety is the first", and the security of user assets should always be the first priority in project evaluation.
Wormhole
Wormhole is a cross-chain communication protocol developed by Solana and Certus.One and launched on September 22, 2021. It was initially used to realize cross-chain token assets between Ethereum and Solana. As of now, Wormhole can support asset transfer functions on multiple chains including BSC, Avalanche, Terra, Base, etc. Wormhole, as the one with the highest market value among the three major chains, has a slightly different fee structure. According to official disclosures, for Wormhole Gateway, the GAS of the source chain is currently the only cost, and users only need to pay GAS.
According to Dune data, as of now, the vast majority of cross-chain transactions still come from Ethereum to Solana, accounting for about 50%, followed by Bsc, accounting for about 15%. Unlike the market entry point of other cross-chain protocols, the L2 share of Wormhole cross-chain accounts for a small proportion.

Wormhole cross-chain sources and number of transactions (from Ethereum to other chains), data source: Dune
Due to the design of the protocol fee mechanism, we cannot obtain intuitive revenue data. Therefore, we measure Wormhole's business performance from the perspective of user activity and transaction volume. Wormhole performed well in Q1 this year, with the highest daily transaction volume approaching 50,000. The increase in transaction volume in January was mainly due to the active on-chain transactions caused by the wealth-making effect of Solana's ecosystem MEME Coin, and cross-chain transactions to Solana accounted for half of the total, which eventually led to a surge in transaction volume in January. However, as the Solana MEME narrative gradually weakened, Wormhole's transaction volume also declined visibly. For most of this year, it remained stable at around 3,000 to 5,000.

Wormhole daily cross-chain transaction volume, data source: Artemis
For token investors, Wormhole's native token $W has limited value capture capabilities. The main function of $W is to conduct on-chain governance after staking. Unlike other cross-chain protocols, Wormhole uses the POA consensus mechanism, where validators are composed of 19 "trustworthy" large institutional validators and do not need to stake tokens when verifying inter-chain messages. This not only reduces the application scenarios of the token $W, but also the validators under the POA mechanism lack sufficient economic incentives, and the cost of doing evil is significantly reduced.
LayerZero
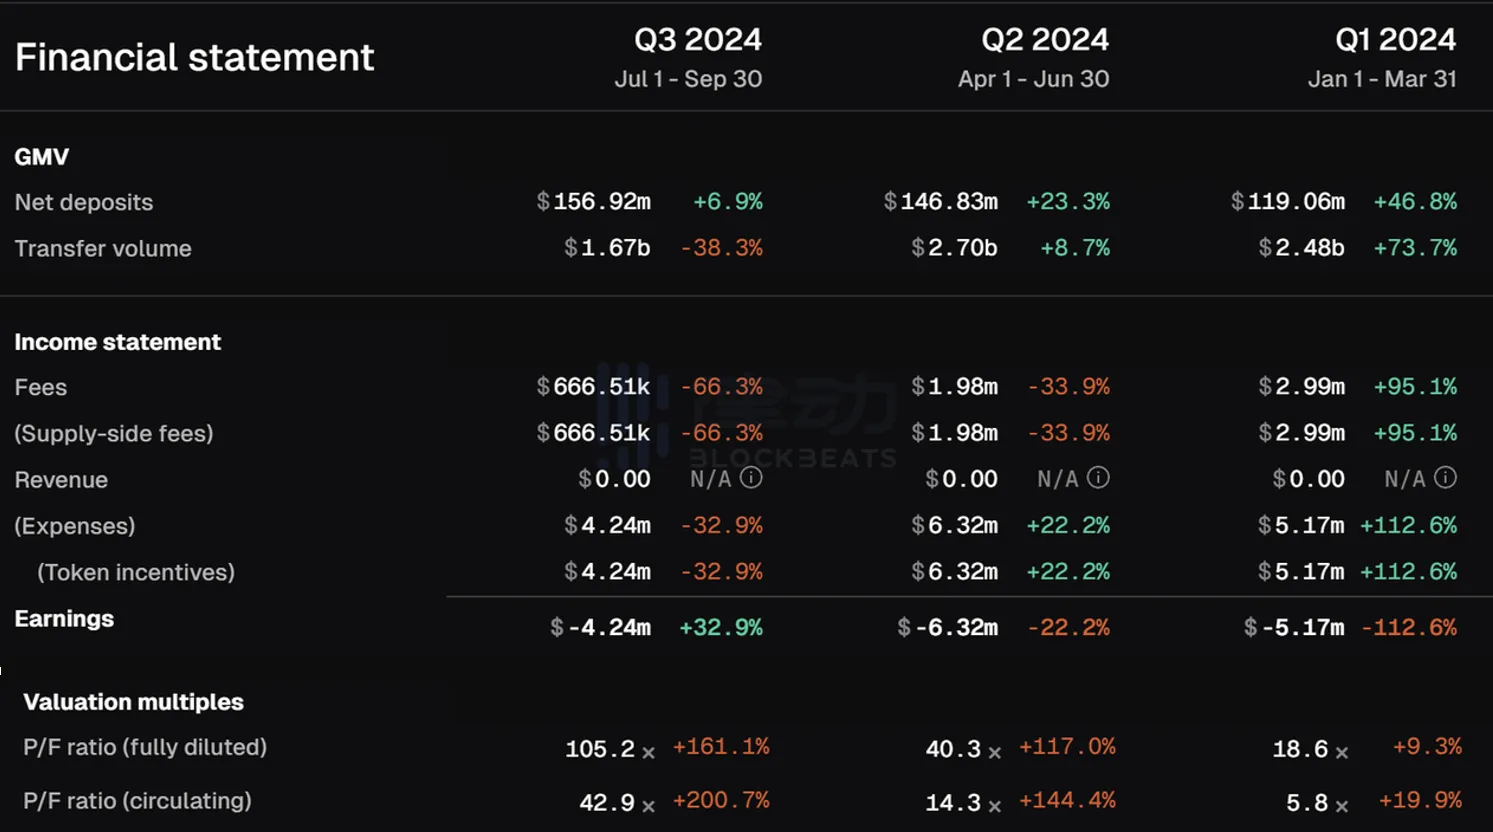
As the underlying protocol for full-chain communication, LayerZero's current main application scenario is the transfer of token assets, as well as NFT, cross-chain governance and other operational use cases. LayerZero's revenue mainly comes from cross-chain information fees: when users transfer their token assets from the source chain to the target chain, the LayerZero protocol will charge fees from the source chain in the form of currency. In the most recent quarter (2024 Q3), LayerZero's main sources of income were Arbitrum, BNB Chain and Ethereum. At the same time, in Q2 of this year, due to the reduction of GAS, the proportion of cross-chain transactions of Arbitrum and Optimism networks increased significantly. As the head protocol in the cross-chain track, its integrated dapps also successfully broke through the 50,000 mark this year.

Left: LayerZero's revenue source ratio; Right: LayerZero's cumulative number of integrated applications, data source: Dune, LayerZero official website
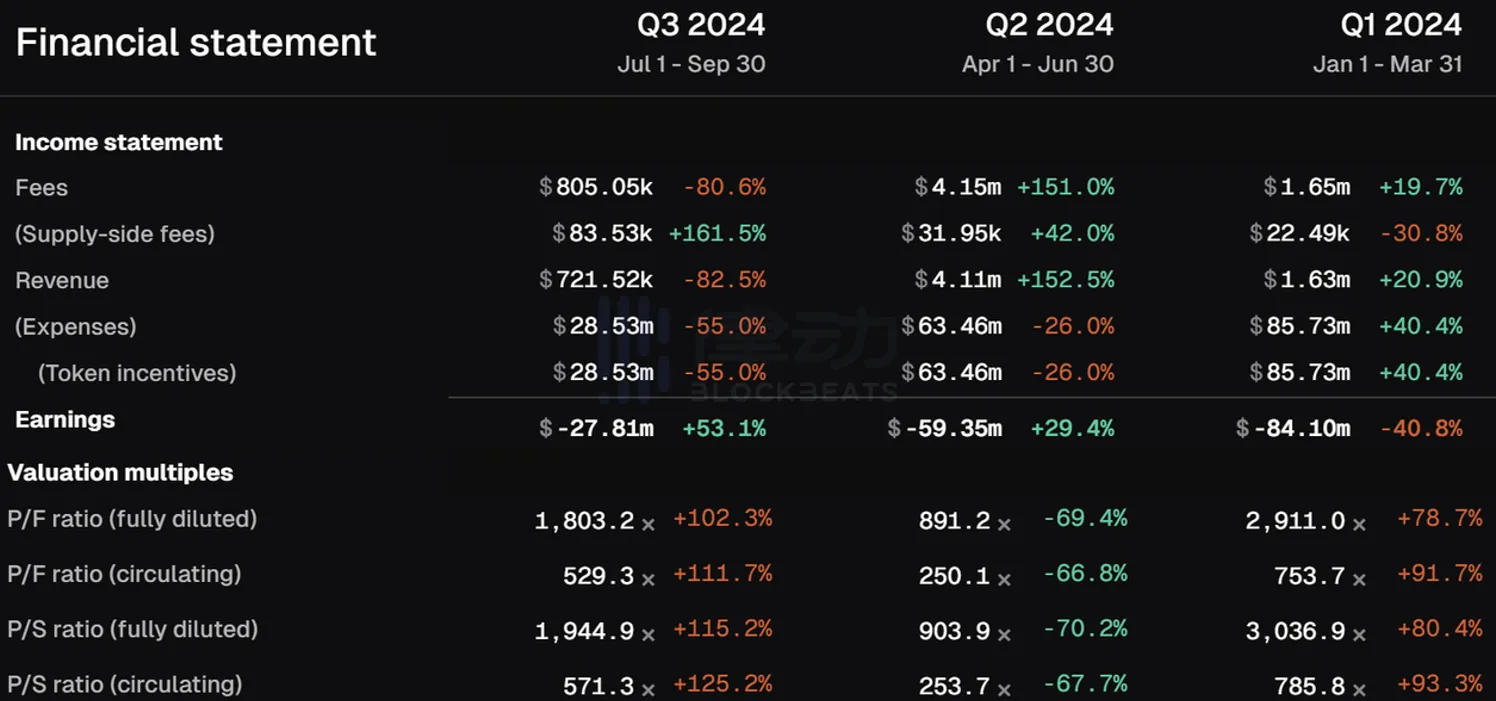
According to Dune data, LayerZero's revenue in the three quarters of 2024 was: US$37.6879 million, US$12.8626 million and US$972,700 (as of August 31). It can be clearly seen that LayerZero's protocol revenue and began to decline sharply after entering Q2 and never recovered. On the one hand, because LayerZero officially issued tokens in June and took anti-witch measures before that, many data whitewashings were cleaned up; on the other hand, the overall market environment was bearish in May, and the sharp decline of major public chain tokens made its revenue worse.

LayerZero monthly revenue and share, data source: Dune

LayerZero daily transaction statistics, data source: Dune
LayerZero's overall operating conditions are closely related to the activity of the on-chain market. When the on-chain market is bullish, Layerzero's operating data also takes off. After May of this year, the market went bearish, and its revenue was close to "foot-cut", slightly higher than the level of the previous round of bear market. This is not only due to the market environment, but also the substantial reduction in GAS fees brought about by the Cancun upgrade is also an important factor in the decline of Layerzero's revenue by an order of magnitude.
LayerZero's native token is $ZRO, which had a market value of 1 billion when it was just launched in June this year, but has now been halved to 433 million. $ZRO is Layerzero's governance token and can be consumed during cross-chain messaging. In terms of fundamentals, Layerzero's P/F ratio is still overvalued because the decline in market value is smaller than the decline in revenue.
Axelar
Axelar's business model still uses the traditional "rent collection" method. Transactions and smart contract executions on the Axelar network will incur corresponding fees, which are paid in AXL tokens and bring direct income to the network. Users who conduct cross-chain transactions will pay GAS to the Axelar network, which will then redistribute it to stakers. Axelar's main expenditure is the $AXL token rewards paid to validators. At the same time, Axelar is also developing AVM, intending to open up cross-chain smart contract development. According to official data, the main cross-chain transactions currently come from BNB Chain and Sei. The transaction volume of the two is US$3.4 billion, accounting for about 40% of the total transaction volume.

Axelar official statistics on cross-chain transaction distribution map, source: Axelar official website
From 2024Q1 to 2024Q3, whether in terms of transaction volume or cross-chain fees, Axelar's various indicators denominated in US dollars are not optimistic, with a sharp drop of more than 50% year-on-year, showing an accelerating downward trend. From the perspective of price-earnings ratio, Axelar's P/F ratio in the third quarter did not decrease but increased. The main reason is that its market value has declined by about 30%, which is less than the halving of cross-chain fee revenue, so the P/F ratio is generally inflated.
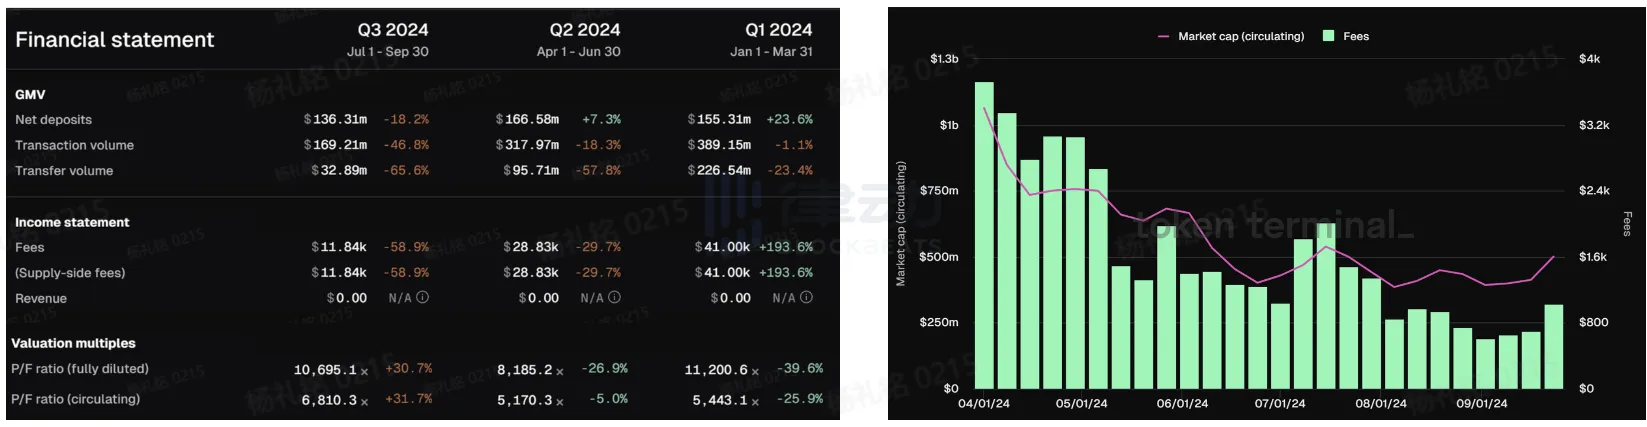
Left: Changes in Axelar's quarterly financial indicators; Right: Axler's market capitalization and transaction fee comparison chart, data source: Tokenterminal
In terms of user data, Axelar's daily active users formed a double peak in mid-January and mid-July this year, with the highest daily active users reaching 4.5K. But after mid-July, it gradually fell back to around 1.5K. Compared with 2023, Axelar's users this year remain active as a whole. It is worth noting that the proportion of GMP (General Messaging) in the Axlear network has continued to increase, and has almost completely replaced simple asset cross-chain, accounting for 98% of the total active users.

Axelar monthly activity data, data source: Axelar official website
Axelar has currently linked 66 chains including Ethereum, BNB Chain, Arbitrum, Fantom and other mainstream public chains. As the number of linked networks increases, the threshold for validators will also increase, and the corresponding token rewards will also rise. Initially, such a plan would lead to an increase in the inflation rate of $AXL. After the official realized the problem, it replaced it with a GAS burning mechanism. The change in the overall token inflation mechanism is beneficial to the $AXL token investors, and its annual inflation of 11.5% can be offset by 10% through GAS burning.
Across
Across is a cross-chain protocol supported by UMA, which relies on UMA's optimistic oracle mechanism to achieve cross-chain between L2 and L1. Currently supported chains include mainstream L2 public chains such as Arbitrum, Optimim, Base, Linea, and Blast.
In terms of the technical design principle of cross-chain, Across introduced the relayer ReLayer, and relied on it to lock the token assets of the source chain and release the corresponding tokens in the target chain. After the relay execution is completed, the optimistic oracle will perform subsequent data verification to ensure asset security and reward the relayer. The Relayer in the Across network relies on the liquidity of the corresponding tokens provided by the LP on the target chain when bridging. If the liquidity is exhausted, the user's cross-chain cost will surge.
Therefore, the good operation of Across is inseparable from the participation of the left and right hands "Relayer" and "LP". Both parties bear all the risks involved in any bridge event on Across, and users pay fees to them when using cross-chain services. On the one hand, the operating model of the liquidity pool is essentially similar to AAVE or Compound, and its pricing scheme also refers to the pricing design of AAVE and adopts the interest rate pricing model: the interest rate R is calculated through the model, and the LP fee is calculated based on a one-week trading cycle. On the other hand, the relayer will advance GAS when crossing the chain, and will receive fee compensation after the transaction is successfully verified. Therefore, when evaluating whether Across operates well, transaction volume and transaction fees will be more fair evaluation criteria.
According to DeFiLlama data, Across's transaction volume in the past month was $637.94m, ranking sixth among cross-chain applications. As of September 11, Across's cumulative users have exceeded 2 million, and monthly active users have stabilized at around 200,000.
Cross-chain application ranking (sorted by transaction volume), data source: DefiLlama
At the same time, according to data provided by Dune, the cross-chain transaction fees caused by Across in Q2 this year are already comparable to the daily transaction fees at the end of the last cycle. It has reached the level of 60,000 US dollars per day. Although Across is not as famous as other cross-chain applications, it still has a certain competitiveness in the market.

Across daily cross-chain transaction fees and composition, data source: Dune
In terms of cross-chain transaction volume, Across's cross-chain volume reached a high level of 2.4 billion US dollars in Q1 at the beginning of the year. Subsequently, the MEME craze in Q2 maintained the cross-chain transaction volume above 2.5 billion US dollars. However, contrary to this, although the number of on-chain transfers has increased, the handling fee has not increased to its due level. Instead, it reached its peak in Q1 this year, then fell 33% in Q2, and halved 66% in Q3. The reason for the decline in Q2 is that the Cancun upgrade has caused a significant drop in L2's cross-chain GAS. In Q3, the transaction volume declined due to the sluggish market.
Across's financial indicators, data source: TokenTerminal
From the perspective of token investment, Across's native token $ACX has weak value capture capabilities. $ACX can be used to manage DAO funding decisions and as a lock-up reward for LPs. Across has proposed an LP lock-up reward plan. The longer the lock-up time, the more multiplier rewards and $ACX token incentives you will get. Since the Snapshot proposal was passed in September 2023, Across has increased the APY % of the liquidity pool by 50% and reduced the original 3x multiplier to 2x.
Obviously, for the Across project itself, there is no direct correlation between its profitability and the price and market value of the token. Although the transaction fees of the Across network have been cut in half and cut in half again, the market value of its token $ACX remains stable, maintaining at around US$120 million. Therefore, the decrease in transaction fees has led to an increase in the P/F ratio, and the overall project is overvalued. But for investors, the overall high P/F ratio does not seem to have a direct impact on the investment decision of $ACX.

Across transaction fees and circulating market value comparison chart, data source: Tokenterminal
Stargate
Stargate is officially launched by LayerZero and is a composable liquidity transmission protocol developed based on LayerZero technology. Stargate is positioned to become a cross-chain application for the entire chain DeFi. It currently covers more than 10 public chains including Abriturm, Scroll, Base, Linea, etc. According to DeFiLlama data, its scale has reached $1b in the past month, second only to Arbitrum Bridge, ranking second.

Data source: DefiLlama
In addition to cross-chain interaction, Stargate also has businesses such as building liquidity pools and staking mining. The Pool model is similar to Across. When building a full-chain cross-chain, LP is required to provide corresponding liquidity on the target chain of the Stargate cross-chain. Investors can provide liquidity as LPs and obtain corresponding returns. On the other hand, users can stake LP tokens to obtain $STG token rewards.
Stargate's revenue channels mainly come from the handling fees charged for token transfers. For non-$STG token transfers, a fee of 0.06% will be charged for each transaction. Among them, LP and veSTG holders will receive a fee allocation of 0.01% respectively.
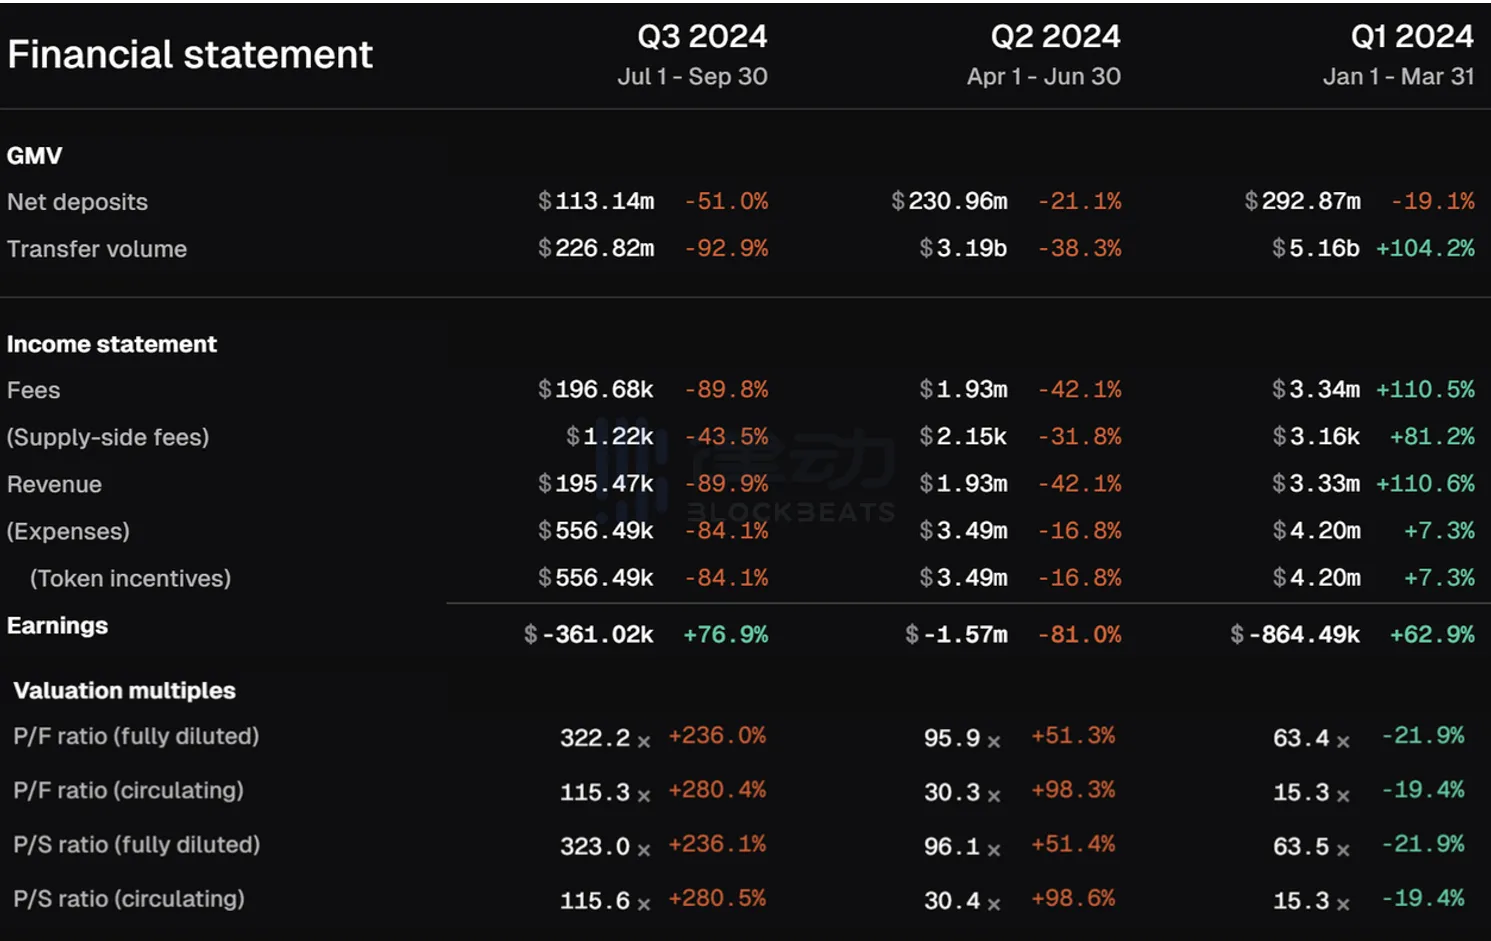
However, Stargate's transaction fees have been declining since the beginning of the year. The highest reached $3.34 million, and it was as low as $196K in Q3. However, compared with Across, Stargate's business flow is still huge, and the transaction volume remained between $3 billion and $5 billion in the first two quarters, but it declined severely in Q3, only $226.82M.
Changes in Stargate's various financial indicators, data source: Tokenterminal
The protocol fees collected by Stargate began to plummet after May this year, and the total fee income in Q3 this year evaporated 90% compared with Q2. However, the circulating market value of $STG did not decrease with the reduction of total fees, and it has always remained at around 120 million. As a result, the P/F ratio surged in Q3, and from this perspective, the price of $STG is seriously overvalued.

Stargate transaction fees and circulation market value comparison chart, data source: Tokenterminal
Compared to $ACX, Stargate's native token $STG adopts the ve model design in token economics, which has stronger value capture capabilities. Token holders obtain veSTG by staking $STG, vote on Stargate's fee standards, liquidity pool adjustments and other matters, and participate in community governance. At the same time, as the time of staking STG tokens is extended, users can obtain additional veSTG rewards to increase their weight in community governance, and the positive flywheel can be accelerated. On the other hand, users can provide $STG to the platform to increase liquidity, or they can obtain $STG rewards through mining. Overall, the market value of $STG is relatively stable.
Storage
If Web3 can achieve true Massive Adpotion in the near future, decentralized storage of data is crucial and will become an indispensable part. Although the overall data storage scale of Web3 is insignificant compared to traditional Web2 storage, this also means that future Web3 storage projects have a higher ceiling and a huge stock market. In the field of storage infrastructure, we selected two major projects, Filecoin and Arweave, for comparative analysis.
Filecoin
Filecoin adopts a pay-per-use model, rather than Arweave's one-time deal. Filecoin's storage providers (i.e. miners) mine $FIL by providing storage services to Filoin users or committing storage capacity on the network. To encourage long-term network coordination, 25% of the block rewards received by miners can be used immediately, while 75% will be unlocked linearly within 180 days. Secondly, if users need to use storage services, they need to pay a certain $FIL fee. Similarly, when they need to retrieve and retrieve in the future, users also need to pay a certain fee.
In general, Filcoin's operating income is mainly composed of user interaction GAS and fines and confiscations from miners, and the $FIL token reward to miners is the main expenditure under its business model. At the same time, Filecoin is actively transforming to on-chain computing and has developed FVM to facilitate developers to develop applications on Filecoin to complete ecological construction.
According to Messari data, the number of Filecoin users with storage scale greater than 1,000 TiBs is increasing. Such users are usually enterprise-level users with large data storage and good stickiness.

Changes in Filecoin users with storage greater than 1,000TiBs, data source: Messari
According to TokenTerminal data, Filecoin's fee income has continued to increase from the beginning of the year to the end of June, with an increase of up to 151%, but the overall fee has dropped sharply since entering Q3. From the expenditure side, Token incentive, as a block reward, has begun to decline rapidly since the end of Q1. This situation is not only caused by the spiral design of Filecoin's token economics, but the main reason behind it is the increasing loss of miners. According to Filscan data, since the end of 2023, Filecoin's active storage providers have been "running away". From a traditional valuation perspective, the P/F Ratio was artificially high in Q3 due to the reduction in fees.
Changes in Filecoin's various financial indicators, data source: Tokenterminal

Statistics of active storage providers, data source: Filecoin official website
In terms of token value capture, its token $FIL is not only used as GAS in the Filecoin network, but can also be used as a token incentive for "miners" to provide storage services, and "miners" need to pledge $FIL tokens when providing storage services to ensure the security and service quality of the network. Filecoin's overall token economics design presents a spiraling pattern.
Filecoin’s price in the last bull market was very exaggerated. At its peak, the price of $FIL reached 200 US dollars per coin, and its FDV reached an exaggerated 380 billion. The reason for the price surge is that the unlocking amount of $FIL is small. On the other hand, since the miner reward is based on $FIL, when the price of the coin rises, it will attract miners to enter the market, and miners will buy more $FIL for staking. Thanks to the design of token economics, the price of $FIL finally soared.
However, after the Bitcoin ETF ushered in the bull market this year, the price of $FIL did not usher in a surge like the previous round of bull market. As of the time of writing, the price of $FIL has increased by only 4.6% in the past year. In contrast, the price of Arweave's native token $AR has increased by as much as 313% in one year.

Data source: Coingecko
On the one hand, the market environment is not as expected; on the other hand, unlike $AR, which is close to full circulation, the liquidity of $FIL is about 30%, and there are a large number of unlocked tokens, which puts a certain amount of selling pressure on the overall token price. Investors need to carefully consider between investment projects and project tokens.
Arweave
Arweave is different from Filecoin mentioned above. Its selling point is to realize decentralized permanent storage of user data on the chain. The Arweave protocol is built on the HTTP protocol. Users can access Arweave through Web2 browsers such as Google Chrome and allow individuals with idle hard disk space to store data in exchange for AR tokens
Arweave adopts a one-time fee business model. Users only need to pay the corresponding fees according to the capacity of the stored data to achieve permanent storage. Part of the one-time fee paid by the user is used for the initial storage cost, and the other part goes into the donation Arweave fund for future storage costs.
Although Arweave's user uploaded data is the same as the previous bull market, or even slightly surpassed, reaching a maximum of 8.79T/month. However, compared with Filecoin's user uploaded data, it is still not as expected. According to Starboard data, Filecoin's daily upload volume has reached 1.5E (where 1 EiB=1024 TiB), and Arweave's storage scale is an order of magnitude different from Filecoin.

Arweave daily upload volume, data source: ViewBlock
Filecoin daily upload volume, data source: Starboard
According to the monthly estimate, taking Arweave's average storage of 4T as an example, according to the calculation results of the ar-fee website, it costs about $70,000 to store 4T of data. According to CoinGecko data, the data storage fee for Filecoin to store 4T is $0.76 per month. With the same cost of $70,000, Filecoin can be used for storage for 7,675 years. 7,675 years is obviously not worth mentioning compared to "permanent storage", but for a company or individual, this is almost equivalent to eternity.

Arweave storage fee calculation, data source: https://ar-fees.arweave.dev/
When we re-examine Arweave's "pay once, store forever" business model, such a narrative is not a sexy story from a fundamental logic point of view. First of all, the essence of Arweave is similar to a "time capsule", and its positioning is aimed at small and beautiful projects. It is not attractive to large enterprises. The data that large enterprises need to store is usually private information rather than public information; on the other hand, from a cost perspective, many of the company's data does not need to spend such expensive storage fees for permanent storage, and it is more cost-effective to adopt Filecoin's storage solution. Therefore, in terms of fundamentals, it is difficult for Arweave to attract large customers, which is why its data upload scale remains at 4T.
Although Arweave has a limited audience and a relatively low product ceiling compared to Filecoin, from a micro-data perspective, Arweave's transaction fees are only slightly lower than the previous bull market if priced in currency. The transaction fee in September 2021 was 4468 $AR, worth about $223,400 (50*$4468); the transaction fee in August 2024 was 6685 $AR, worth about $167,125 (25*$6685).

Arweave currency-based transaction fees, data source: ViewBlock
For investors in $AR tokens, $AR assumes the basic payment function of currency. Arweave's native token is $AR. On the one hand, $AR can be used as a means of payment to pay for data storage. When users store data on the Arweave network, they need to use AR tokens to pay a one-time storage fee. These fees ensure the permanent storage of data. On the other hand, miners receive AR tokens as rewards by storing and verifying data. For the token price performance, please refer to the previous analysis.
DA Data Availability
The large public chains we are familiar with usually adopt an integrated, monolithic design, with a single blockchain processing all transactions. However, whether it is social division of labor or Crypto, the development of refined division of labor seems to be inevitable. Since the development of modularization, data availability (DA) has become an indispensable component of Ethereum Lego blocks. Among them, Celestia, EigenDA and Avail are more representative. Due to the limited data of EigenDA and Avail, we selected Celestia for analysis.
Celestia
Celestia's native token is $TIA. Celestia can support developers to develop new public chains and use $TIA to pay GAS. Users can also stake $TIA to get rewards. Due to the popularity of $TIA airdrops, the benefit effect was obvious at the beginning of its launch, up to $20/TIA. After the market cooled, the price of $TIA gradually returned to normal levels.
Celestia's user profile is mainly concentrated in Rollup. L2s on the market use Ethereum for data availability and transaction settlement, which incurs high costs, while the use of Celestia will cause a "qualitative" change in costs. Taking Arbitrum and Optimism as examples, if Celestia is chosen instead of Ethereum, then every 100 million transactions will incur DA costs of $32,598 and $15,333 respectively, reducing the total cost by 89% and 92% respectively.

Arbitrum and Optimism compare the DA cost savings of Celestia on Ethereum, data source: hashedem.substack.com
Modular projects like Celestia have brought great convenience to L2. Reflected in the fundamental data, Celestia's market share is gradually rising. According to Blockworks data, it has reached a market share of 44%. Although Celestia's security cannot be compared with Ethereum, the market needs low DA costs more than security. The low-price strategy has effectively helped Celestia expand its market scale.

DA market share (according to Data post statistics), data source: Blockworks
It can be seen intuitively from the figure below that after each project adopts Celestia, the average cost can be reduced to about 80%-90% of the original.

Cost savings of various projects adopting Celestia, data source: numia.data
Since Celestia can provide DA services at such a low price, is Celestia still making money?
According to Aremis data, Celestia's average daily uploaded data is about 3.5K/MiB, and the data upload fee denominated in USD has decreased from $0.5/MIB in June-July to $0.3/MIB in August-September, plus the GAS that needs to be consumed. So in fact, Celestia's potential annual revenue is relatively low, about a million dollars.
Although Celestia is still profitable at the data level, it has deviated from its valuation to a large extent. According to CoinGecko data, its FDV is 6.4 billion. Perhaps you don't have an intuitive feeling about FDV 6.4 billion, let's compare it to Chainlink at the beginning of the article, whose market value is currently about 7 billion and its FDV is about 12 billion. For Celestia's million-level revenue, it is obvious that the valuation of half of Chainlink is mixed with a lot of water. The actual business model and operation are not enough to support its inflated market value. 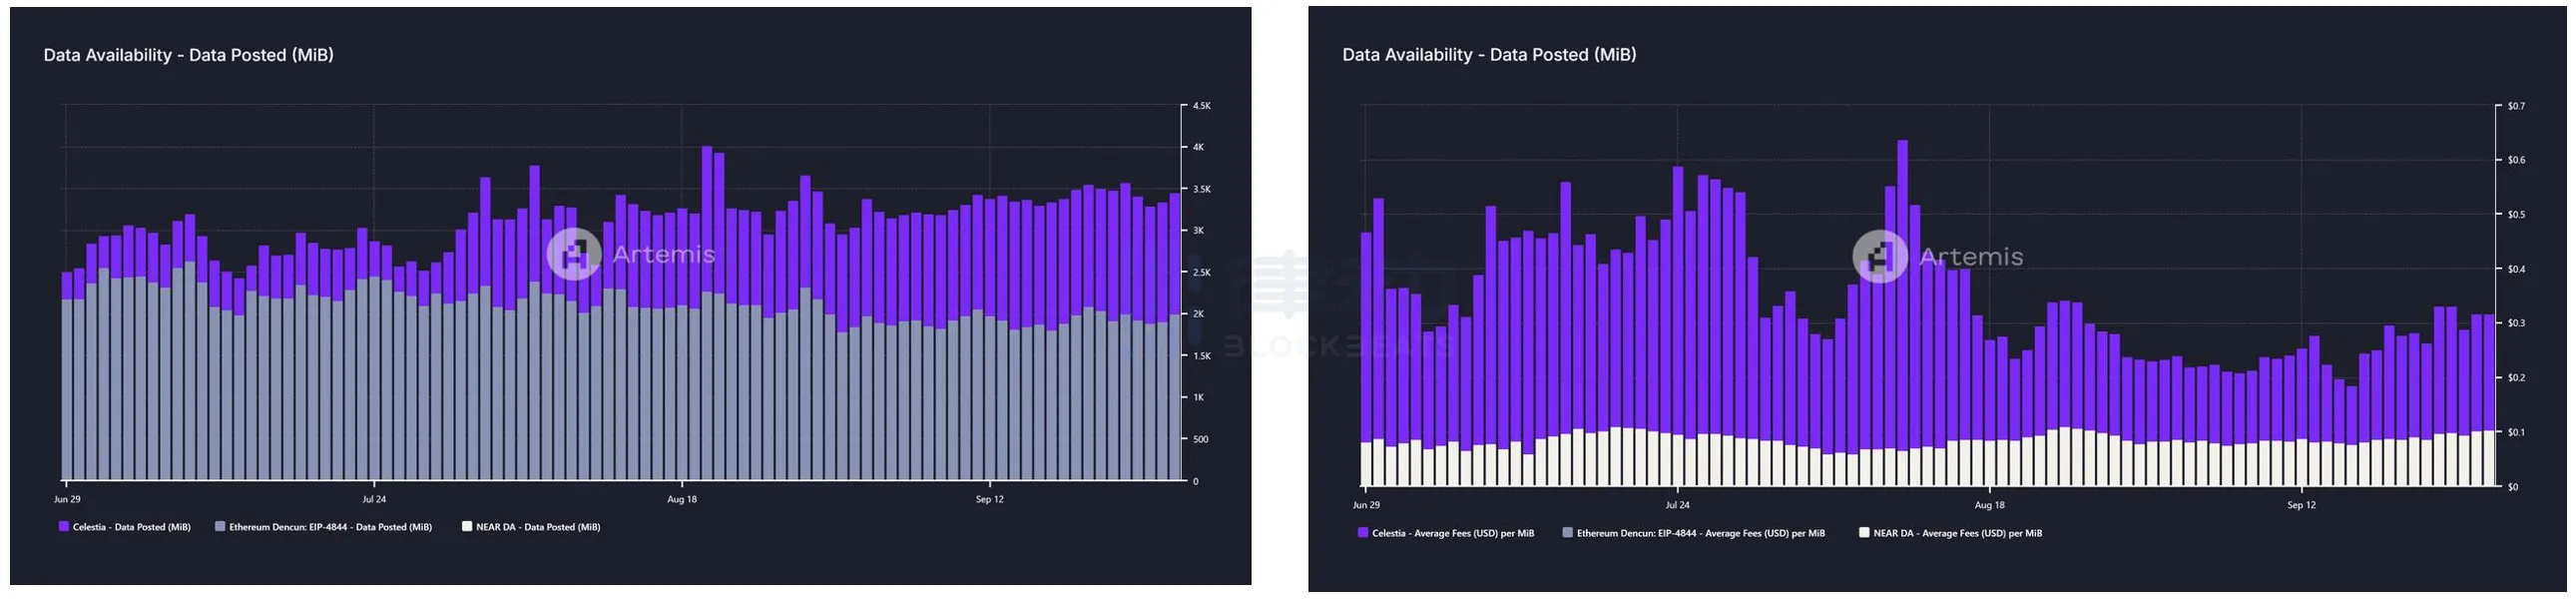 Left: Celestia/Ethereum Data Post; Right: Celestia/Ethereum average cost per MiB, data source: Artemis
On the other hand, $TIA has only unlocked 26% so far, and will face a large unlock of $1 billion on October 30. At the same time, TIA does not have a maximum supply limit. And it is worth noting that Celestia Foundation announced on September 24 that it had completed a $100 million financing led by Bain Capital Crypto, Syncracy Capital, 1kx and other institutions. The official announcement of the completion of $100 million in financing before the unlocking is intriguing.

Token $TIA unlocking status, data source: DeFiLlama
For the DA track, although its main customers are various Roll ups, the current mainstream L2 still uses the Ethereum mainnet as DA, and very few L2s choose Celestia. In addition to whether Celestia's business model can be implemented, the more important thing is the delicate relationship between Ethereum and various L2s. Choosing Celestia is tantamount to openly singing against Ethereum. In this cycle where people can barely survive by huddling together for warmth, the market economy does not seem to be that important.
L2s
As the main theme of this round of infrastructure construction, L2 has achieved "lying down and making money" compared to L1, which often burns money crazily. With the technical support of OP STACK, the development cost of L2 has been significantly reduced, and "one-click chain issuance" has been truly realized. Usually, the cost of L2 is composed of sorters, DAs, development, etc. After the Cancun upgrade, the GAS of L2 has generally decreased by 50%-90%. While enjoying the advantages of L2's low GAS, the market has gradually discovered the shortcomings of L2. Do we really need so many L2s? With this question in mind, we divided them according to technical principles and market value, and selected Arbitrum, Optimism, Base from the OP system and Starknet and zkSync from the ZK system for analysis.

Comparison of transaction fees before and after the L2 Cancun upgrade, data source: hashedem.substack.com
Arbitrum
Specifically, Arbitrum's revenue experienced a sharp drop after Q1. Compared with Q1's $27.38 million, its Q2's $7.37 million and Q3's $3.34 million figures are unsightly, partly due to the sluggish market environment during Q2 and partly due to traffic competition from other L2s.
It is worth noting that due to the Cancun upgrade, Arbitrum's costs were also greatly reduced, so the net profit only fell by 7.3%. Compared with most other infrastructure projects that often see a 70% profit drawdown, Arbitrum's performance is far better than most of its peers.

Changes in Arbitrum's financial indicators, data source: Tokenterminal
As mentioned above, L2's biggest expense is paying DA and settlement costs to L1. Taking Arbitrum as an example, the L1 cost of processing 100 million transactions reached $25,000 per month. Of course, it would be lower if Celestia's service was used. If GAS covers these costs, then running L2 only needs to consider how to reduce the sequencer and initial development costs. When these costs are low enough, L2 is a "rent collection" business that makes money easily, but this is indeed the case.

Arbitrum revenue and expense statistics, data source: Tokenterminal
The user bottleneck has always been a shackle that restricts its development. Arbitrum's number of active users has been difficult to break through after reaching 10 million. Now, as the market cools, the number of monthly active users has also dropped to around 2.8 million. On the one hand, Arbitrum is likely to be overtaken by Base. On the other hand, Arbitrum's ecosystem is not only difficult to attract incremental users, but also needs ecological innovation to revitalize existing users.

Arbitrum monthly active user data, data source: Tokenterminal
Optimism
OP's overall operating conditions are similar to most of them. Its revenue peaked at $18.83 million in Q1, and was halved in Q2 and Q3, falling to $8.95 million and $3.32 million respectively. Although from the perspective of "political correctness", the Optimism project team has a close relationship with the Ethereum technical community and foundation, representing the successor of Ethereum's will in L2, and is more orthodox than Arbitrum's Ivy League circle. But the correct answer given by the market is not Optimism: Arbitrum is on par with it, and Base, which will be introduced later, is even better.

Changes in Optimism's various financial indicators, data source: Tokenterminal
It is worth noting that Optimism and Arbitrum have different retained earnings. Although its on-chain net income is increasing, Optimism is unable to make ends meet after considering the impact of token incentives. According to the U-standard pricing, it needs to pay $91 million, $34 million and 16M token fees in the first three quarters of this year, which is far higher than its operating costs.

Optimism on-chain net income, data source: Dune
In terms of active user data, although Optimism has only 1.6 million active users at most, which is not as beautiful as other OP-based L2s with 10 million, its lower limit is very stable, and the stable "decline" is around 1.2 million. Compared with its fellow sufferers in the ZK-based system, the overall user data of the OP-based system is much better, not only the ceiling is higher, but also the lower limit can be dragged down.

Optimism monthly active user data, data source: Tokenterminal
For Optimism, the overall atmosphere and positioning of the team are more tech-oriented. The OP Stack developed by OP Labs has helped many L2s to launch chains with one click, and has also been further upgraded to OP Succinct and ZK Stack to grab traffic. As for whether the vision of SuperChain can be realized, the answer needs to be given to the team and the market.
Base
Backed by the exchange CoinBase, Base was born with a silver spoon in its mouth from the beginning, and its fundamentals are much healthier than other L2s. As a rising star, it has now become a top player on the L2 chess table. In Q1 this year, Base's transaction fees soared 400% month-on-month. Prior to this, Base relied on "MEME" and "social" to rise to the sky. Due to its low transaction fees, Base has taken the old path of Solana and caused a MEME craze. BALD, BRETT, and DEGEN have successively ignited BASE's MEME fever. Subsequently, BASE integrated social applications friend.tech and Farcaster, becoming a veritable Social-L2.
After a set of combined punches, Base achieved a latecomer and surpassed Arbtrum and Optimism. Its Q1 revenue reached 27M, which is the same as Arbitrum. Despite the 70% decrease in Q3 revenue, its net profit was still as high as 5.84 million US dollars.

Base's financial indicators, data source: Tokenterminal
From the perspective of TVL, Base's success depends on two difficult-to-replicate social fissions. From the initial tepidity to the influx of a large number of new users and funds after the launch of Friend.tech, Base has been pushed out of the novice village, and its TVL has reached the level of 500 million. Subsequently, in March this year, Cancun upgraded GAS and Base launched the same MEME craze as Solana, and on-chain users began to become active. With the help of Farcaster and other Social-Fi, Base's TVL has reached the level of 1.5 billion. So far, Base's TVL is still increasing steadily.

Base TVL growth, data source: DeFiLlama
Unlike other L2s, user data is not the bottleneck restricting Base's development. Base has been steadily improving in terms of user data. The number of monthly active users reached 20 million in September, surpassing other "king"-level L2s. Relying on CoinBase's huge user traffic, the active users that are the most difficult to capture for other L2s have become Base's unique moat.

Base monthly active user data, data source: Tokenterminal
Similarly, Base is a sure win. In addition to the fact that the Base project team knows how to market and how to play, and maximizes traffic, Base's beautiful financial data is also due to the support of Coinbase. As the only sorter on Base, Coinbase has reduced the cost to the lowest level except for DA. Therefore, according to the data from TokenTerminal, except for a few points in time, Base's revenue far covers its costs most of the time.

Base income and expenditure, data source: Tokenterminal
Starknet
As the prince of ZK technology, Starknet has always been highly sought after, but its fundamentals are far from satisfactory. Since entering 2024, Starknet's revenue has only fallen and not rebounded, just like its currency price. Among them, the decline in 2024Q2 was the most serious, with only $147,900 in transaction fees compared to $9.37 million in Q1.
Q2 In addition to the negative impact of the depressed market environment, EIP-4844 and the Cancun upgrade are another important factor. Although the Cancun upgrade brings extremely low DA costs to L2s using Blob, it is a blessing in disguise, and it also brings a decrease in network transaction fees. Since the Cancun upgrade, Starknet's on-chain transaction fees have been sluggish. From the figure below, it can be seen intuitively that Starknet's revenue has been sluggish since Q1.

Starknet transaction fee quarterly changes, data source: Tokenterminal
From the user's perspective, Starknet has gradually become a "ghost town". In January 24, Starknet broke through the bottleneck of 1.2 million monthly active users, and then reached a peak of 2.2 million. Since then, active users have begun to lose in batches, and the user bubble was finally punctured. Today, the number of monthly active users is stable at around 130,000. Whether in level 1 or level 2, on Twitter or in group chats, Starknet’s presence gradually faded.

Starknet monthly active user data, data source: Tokenterminal
zkSync
The last of the four L2 kings to be listed, zkSync, has attracted much attention from the market and public opinion from its debut to the end of listing on Binance. zkSync released a test network in 2021, but the development progress was slow, and the main network was not officially launched until 2023. Although zkSync has a top capital platform, its ecological construction is not as expected. There is no phenomenal dapp that can even attract public attention, which is quite "thunderous but small". Before the issuance of its native token $ZK on June 17 this year, the main flow of the market was also focused on how to "brush data" for zkSync to win airdrops.

Changes in zkSync’s financial indicators, data source: Tokenterminal
Although zkSync’s revenue is as disastrous as most L2s, this only means that zkSync is making less money, at least it is still at the level of “profit withdrawal”. According to Tokenterminal data, its overall revenue can still cover its expenses. However, its net profit is at a lower level than other L2s, falling from $4.7 million in Q1 to $370,000 now.

zkSync income and expenditure, data source: Tokenterminal
It is worth noting that in July this year, zkSync suffered a double blow in revenue and the number of developers, but its active users rebounded, increasing from 2 million in June to 3.8 million, and then the monthly active users plummeted to 800,000. For zkSync, it not only needs to consider how to build its own ecosystem to attract funds and users, and strive to get bigger chips on the L2 battle table, but also how to avoid the vicious cycle caused by its own empty city.

zkSync monthly active user data, data source: Tokenterminal
Obviously, zkSync has realized the problems of weak ecology and loss of existing users in the fierce L2 competition. zkSync's TVL has doubled from 76 million to 140 million since September 20. The recent changes in TVL are mainly contributed by Venus Core Protocol, which increased by 2434% in one week. At the same time, zkSync has recently become the third L2 in terms of weekly active users, but there is still an order of magnitude difference with Arbitrum and Base. Although zkSync has been catching up recently, it still has a long way to go.
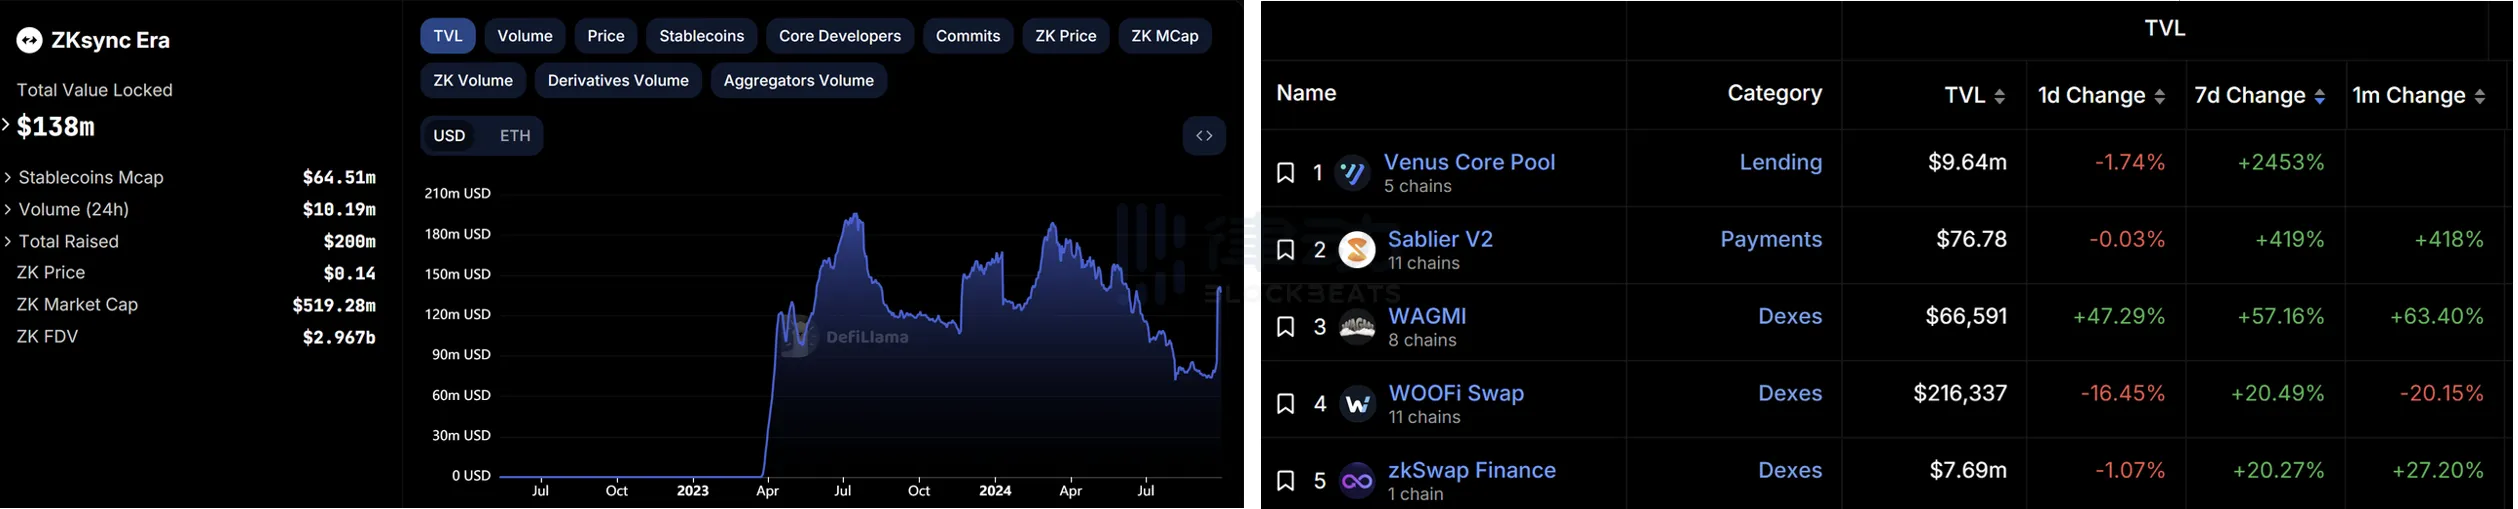
Left: zkSync TVL growth; Right: zkSync TVL share distribution, data source: DefiLlama

L2 weekly address activity ranking, data source: L2BEAT
As for the token economics of the above L2, except for Base, the native tokens of the remaining L2s almost only play a governance function. Although L2 is the right-hand man of Ethereum, users do not need to consume its native tokens in actual transactions, but still use ETH as GAS payment. This also determines that if each L2 does not develop an ecosystem that attracts users, it can only serve as a "transit chain" that saves money. Vitalik, who has the highest voice in the Ethereum ecosystem, recently published an article advocating for the alignment of the entire Ethereum ecosystem. Now, in addition to considering the objective economic laws of market operation, the development of the L2 track has added many uncontrollable "political" factors.
Summary
For infrastructure projects with huge current valuations, maintaining sky-high FDVs depends more on the imagination of their narratives. However, the current situation where the exaggerated valuations of infrastructure projects are inconsistent with their actual operating conditions will not only cause the market to fall into the bubble of the "unending prosperity" of the previous bull market, but also the mindset of everyone wanting to earn rent while lying down has brought hidden dangers of the tragedy of the commons to Crypto.
猜你喜歡

Sui 加密貨幣價格預測:SUI 價格預計將于2026年1月10日下跌至$1.31
主要收穫 Sui 加密貨幣最近價格呈上漲趨勢,但市場情緒仍然看跌。 技術指標顯示SUI價格可能會在未來五天內下跌23.27%。 SUI在過去30天內已上漲21.80%,目前交易價格高於50日和200日簡單移動平均線。 投資者情緒指標「恐懼與貪婪指數」顯示市場仍處於恐懼狀態,暗示有潛在購買機會。 WEEX Crypto News, 2026-01-06 10:06:51 隨著加密貨幣市場的廣泛波動,Sui 加密貨幣(Sui Crypto)近期的市場表現引起了投資者的極大關注。根據CoinCodex的技術分析,SUI的價格預計將於2026年1月10日下跌至1.31美元,相比現價1.88美元,這意味著未來五天SUI將下跌23.27%。 最近Sui 加密貨幣的市場表現 在過去的30天裡,Sui 加密貨幣呈現出積極的走勢,價格上漲達21.80%。然而,從中長期來看,SUI表現並不理想,過去3個月下降了45.82%,與去年同期相比下降了63.98%。Sui…

Kaspa價格預測:KAS價格到2026年1月9日將下跌至$0.038894
關鍵要點 Kaspa在未來五天預計將下降23.35%,預測價格達到$0.038894。 目前的市場情緒偏向看跌,恐懼與貪婪指數顯示極度恐懼。 KAS在最近30天顯示負面趨勢,價格下降了4.48%。 技術分析指標大多中性,但長期移動平均線顯示出看漲信號。 WEEX Crypto News, 2026-01-06 10:06:55 Kaspa現狀與未來展望 Kaspa(KAS)是一個受投資者密切關注的加密貨幣,其未來走勢在近期更是備受市場熱議。根據Kaspa的價格預測,KAS可能在未來五天內下跌至$0.038894,這將代表著一個-23.35%的價格下降。這一趨勢不僅反映出當前加密貨幣市場的波動性,也顯示出投資者對於Kaspa未來發展的謹慎態度。 在撰寫本文時,Kaspa的交易價格為$0.051824,過去24小時內增長了5.18%,相較於整個加密市場3.52%的增長率,表現出色,同時也相比於比特幣取得了3.28%的優勢。然而,總體市場情緒仍保持在極度恐懼(25)的水平,顯示出投資者的參與度較低,市場觀望情緒濃厚。 Kaspa的近期表現 在最近的30天中,Kaspa的價格整體走勢呈現下降趨勢,跌幅達到4.48%。從中期來看,Kaspa的表現更加悲觀,過去三個月中價格下降了34.90%。1年期的長期趨勢同樣不容樂觀,比起去年同期KAS的交易價格$0.127541,如今的下跌幅度達到了59.37%。2024年8月1日Kaspa達到歷史價格高點$0.208892,而現今價格的高位和低位分別是$0.066494和$0.020431,顯示出近半年來Kaspa的市場波幅。 這段時間Kaspa的市場波動性下降,最近一個月的波動率大約為6.27%,這意味著市場的劇烈波動有所減緩。這段時間中,Kaspa有13天的交易日錄得正增長,表明某些情況下仍存在獲利機會。 技術分析與市場情緒 Kaspa的技術分析表明,目前市場情緒普遍偏向看跌。在技術指標中,有12個顯示出看漲預測,而14個顯示出看跌預測,54%的指標傾向於負面預測,這使得市場對Kaspa的整體預期變得較為謹慎。…

以太娜價格預測:ENA價格預計將降至$0.192294於2026年1月11日前
重點摘要 當前以太娜價格為$0.249202,在未來五天內可能下降23.08%。 市場情緒呈現看跌狀態,恐懼與貪婪指數為44,顯示市場普遍存在恐懼。 本月以來,以太娜的價格波動性高,過去30天有16天價格上升。 關鍵支撐點分別在$0.242274、$0.231037和$0.222901;主要阻力位於$0.261648、$0.269784及$0.281021。 技術分析指出,雖有少數指標表現看多,但總體上68%的指標持看空預測。 WEEX Crypto News, 2026-01-06 10:06:52(today’s date,foramt: day, month, year) 頗具投機性的加密貨幣市場中,價格預測和走勢分析一直備受投資者關注。以太娜(Ethena,ENA)的價格在近期吸引了眾多目光,根據市場數據顯示,ENA的價格預計將在未來幾日內下降約23.08%,降至$0.192294。這一預測激發了市場中對該貨幣的關注及討論。 以太娜近期市場表現 以太娜目前的交易價格為$0.249202,過去24小時內價格上升了3.27%。這個漲幅在一定程度上優於整體加密市場的2.01%上升率。此外,相較比特幣(BTC),ENA當日前進了1.94%,顯示出相對較好的表現。然而,若將當前價格與過去30天相比,以太娜錄得-4.77%的跌幅,更長期來看,於過去三個月內下滑了-53.74%,而整體一年內更是驟降79.96%。…

木星幣價預測——JUP價格預計至2026年1月9日跌至$0.165879
關鍵要點 木星幣(JUP)價格預期在接下來五天內下降23.33%。 當前的價格為$0.217225,比特幣表現出色。 最近30天木星幣呈現負向趨勢,並在過去三個月內下跌54.07%。 市場情緒當前偏向熊市,恐懼與貪婪指數顯示為極度恐懼。 WEEX Crypto News, 2026-01-06 10:06:54 在加密貨幣市場中,木星幣(JUP)的價格表現和預測不容忽視。在本文中,我們將深入分析JUP在未來幾天的價格變動及其潛在的市場走向。本文中所使用的數據來自於過去的市場表現以及多項技術分析指標的結果。 木星幣的現狀與未來預測 截至目前,木星幣的交易價格為$0.217225,經過過去24小時的市場波動後,這一價格已提升4.13%。相較於整體加密市場的平均增長4.49%,木星幣顯得尤其突出。與比特幣相比,JUP今日也獲得了3.21%的提升。 然而,根據市場預測,JUP的價格很可能在未來五天內下滑至$0.165879,這將代表著23.33%的降幅。同時,木星幣在過去30天內已經下跌了4.70%,中期走勢呈現熊市,不容小覷。在過去一年,JUP顯示出77.10%的價格變化,這突出了其在市場中的不穩定性。 近三十天的木星幣走勢 在過去的一段時間裡,木星幣一直表現不佳。這段期間內它不僅失去了價值,也顯露出其波動性相對較低的特點。1個月的波動率達到8.64,讓投資者小心謹慎。今年木星幣的最高價出現在4月1日,當時達到$1.84的高點。而目前的周期高點為$0.221866,低點則為$0.168834。 值得注意的是,市場上的蜂巢情緒指數為25,這意味着投資者情緒非常不安,普遍呈現極度恐懼的狀態。這種產品心理指數的顯示常常預示著潛在的買入良機。 木星幣的技術分析…
Polymarket 發佈房地產市場預測 – 加密交易者現可投機房價
Key Takeaways Polymarket 與 Parcl 合作,讓加密交易者能不擁有房產卻可參與房地產市場價格預測。 用戶可根據大都會區的房價指數變動,交易房價指數上升或下降的合約。 這一新類別將房地產引入 Polymarket 已經涵蓋的大型預測市場中,如選舉、體育和宏觀經濟指標。 透過與 Parcl 的合作,市場解決僅憑明確且可驗證的數據進行結算的要求。 WEEX Crypto News, 2026-01-06 10:07:43…

Worldcoin 被預測在2026年1月11日跌至 $0.483911
主要見解 Worldcoin 預測價在未來五天將下降23.12%,至 $0.483911。 近期市場情緒顯示,目前對 Worldcoin 的看法偏向看跌。 前50天和200天的移動平均線表明市場趨勢呈看漲。 目前的恐懼與貪婪指數顯示投資者的市場展望偏負面。 加密市場的波動性令 Worldcoin 的長期價格預測充滿挑戰。 WEEX Crypto News, 2026-01-06 10:06:52 Worldcoin…

卡爾達諾價格預測:2026年首度金叉出現——聰明的資金已經在買進中嗎?
主要摘要 卡爾達諾(Cardano)在2026年開年即迎來罕見的金叉,價格預測顯示其走勢極為樂觀。 短期價格表現超越中期趨勢,9日均線已越過21日均線,顯示可能出現翻轉信號。 24小時交易量激增31.35%至6.1485億美元,暗示大資金持有者可能已開始動作。 若此金叉能夠爭取到強勁支撐,卡爾達諾有望展開225%的漲幅,並在2026年進一步抬升。 WEEX Crypto News, 2026-01-06 10:07:41 卡爾達諾的看漲信號 2026年對於卡爾達諾而言似乎是一個振奮人心的開端。一道罕見的「金叉」出現在其走勢圖上,引起投資者的廣泛關注。金叉是指短期均線由下向上穿過長期均線,通常被視為強勁的多頭信號,代表著潛在的上漲可能性。 在技術面上,卡爾達諾價格正面臨著極為看好的預測。短期的價格行為已經超越了中期趨勢,9日移動平均線已經超過了21日移動平均線,此類型的交叉通常被解讀為潛在的翻轉信號。這意味著市場可能從持續的下跌中反轉,轉向上升。 儘管在去年12月早些時候曾出現過一次短暫的金叉,但此次金叉伴隨著顯著的交易量增長,引發市場的猜測:此次的金叉是否預示著新一輪牛市的開始。 交易量激增:聰明資金的佈局 伴隨著此次金叉的出現,卡爾達諾的24小時交易量激增了31.35%,達到6.1485億美元。如此顯著的增長通常暗示著大型資金持有者的入場。這類資金被認為較為聰明,通常會提前佈局,在市場出現明顯趨勢之前做出投資決策。 這一波的價格上漲似乎得益於聰明資金的進場,而歷史數據一再顯示,當聰明資金採取行動時,散戶投資者往往會隨之跟進,進一步增強市場的動能。 下一次牛市即將來臨?…

Shiba Inu 價格預測:9個綠色蠟燭和黃金交叉——SHIB即將爆發
主要要點 隨著Shiba Inu 價格上漲20%,未來幾年的價格預測再度升溫。 近期出現的黃金交叉表明強勁的牛市走勢可能繼續。 一旦超越0.00000900美元大關,將可能抹去一個零並重返高點。 SUBBD 將成為2026年最值得關注的AI加密貨幣之一。 Shiba Inu 和SUBBD 的市場動態正受到廣泛的關注和討論。 WEEX Crypto News, 2026-01-06 10:07:43 在過去的幾天內,Shiba…

XRP 價格預測:XRP 突破三個月下行趨勢——2026 年達到 5 美元?
關鍵要點 XRP 最近突破了三個月的下行趨勢,價格上漲了 18%,突破了關鍵的 2.20 美元阻力位。 分析師預測,根據艾略特波浪理論,XRP 可能在 2026 年上漲至 5 美元。 破除自 2017 年以來多次未能突破的 2.00 美元阻力,意味著長期供應枯竭。 若能突破…

領先的AI Claude預測到2026年底XRP、Shiba Inu和Solana的價格
主要要點 Claude AI對XRP的預測是,到2026年底,XRP價格有可能達到10美元。 Shiba Inu(SHIB)或許會比上個高點增長7000%。 Solana(SOL)預計可能會有高達500%的強勁反彈。 Maxi Doge(MAXI)作為新興的迷因幣,具備潛在的巨大增長空間。 WEEX Crypto News, 2026-01-06 10:07:43 Anthropic的Claude AI,以強大的演算法,近期針對XRP、Shiba Inu及Solana這三大加密貨幣發布了最新的價格預測。作為2026年的新年展望,Claude AI表示這三個數位資產將在本年度創下史無前例的新高,有可能達到先前高峰的三倍或更多。 XRP(XRP):預計將達到令人振奮的10美元…
Bittensor 預測:以太坊價格走勢與市場情緒分析
關鍵要點 預計 Bittensor (TAO) 將在未來五天內降至 205.29 美元,此價格減幅為 -23.40%。 市場情緒顯示 TAO 當前為看跌趨勢,投資者信心不足。 最近 TAO 對美元上漲 3.94%,對 BTC 上升 2.69%,…

Official Trump價格預測:TRUMP價格預估將降至$4.15 (截至2026年1月9日)
主要觀點 預測顯示TRUMP在接下來的五天將下降23.18%。 市場情緒偏向於看空,恐懼與貪婪指數顯示為極端恐懼。 近期技術分析中,多數指標顯示為賣出信號。 長期而言,TRUMP過去一年仍有約26.22%的價格增長。 WEEX Crypto News, 2026-01-06 10:08:54 在近期的加密貨幣市場分析中,Official Trump(以下簡稱TRUMP)的價格走勢及其未來五天的價格預測成為關注焦點。根據最新資料顯示,TRUMP目前的交易價約為$5.42,市場預期其價格將在2026年1月9日下降至約$4.15,這意味著在未來五天內TRUMP價格可能會減少23.18%。 正處於極端恐懼之中的市場 目前加密貨幣市場正處於「極端恐懼」的狀態,恐懼與貪婪指數低至25,顯示出投資者的悲觀情緒。雖然TRUMP在最近24小時內表現突出,達到7.85%的漲幅,甚至相較於BTC還經歷了6.33%的收益,但整體市場情緒依然不容樂觀。 近期及歷史價格動向 回顧過去30天,TRUMP表現一直顯示出負面走勢,當前趨勢似乎支持其中期走跌的預測。過去三個月內,TRUMP價格下降了31.28%。然而,若放眼更長遠的時間範疇,過去一年TRUMP的價格仍然增長了26.22%。 2025年1月19日,TRUMP曾達到歷史最高點$76.98,然而自此之後價格一路走跌。目前,其循環高點為$9.56,而低點則為$4.19。這段期間內TRUMP的波動幅度較小,月度波動率僅為7.00%。 關鍵支撐和阻力位…
Ondo Finance 預測:2026年1月9日價格將跌至 $ 0.335745
主要要點 根據最新預測,Ondo Finance (ONDO) 在未來5天內預期將下降23.36%,達到 $0.335745。 當前市場情緒顯示看跌傾向,並且投資者持有極端恐懼情緒。 ONDO最近30天表現不佳,30天內價格已下跌9.45%,一季度內更是下跌了52.77%。 長期來看,自去年以來,ONDO價格已減少72.21%。 2026年1月的技術分析顯示大多數指標均指向看跌,但也有少數買入提示。 WEEX Crypto News, 2026-01-06 10:08:53 在當前激動人心的加密市場中,Ondo Finance (ONDO)…

七大中國金融協會裁定RWA代幣化非法
關鍵要點 中國七大金融協會聯合宣布,實體資產(RWA)的代幣化活動在中國屬非法金融活動,且不具法律依據。 RWA與穩定幣、”無價值的加密貨幣”和挖礦活動一起,被列為非法虛擬貨幣活動的主要表現,並被視為高風險和欺詐方法。 中國的金融監管機構並未批准任何形式的RWA代幣化活動,強調這種活動涉及資金非法籌集、未經授權的公開發行、非法期貨業務操作等多種違法行為。 國內涉及RWA的整個Web3服務生態系統面臨法律責任,尤其是那些為虛擬貨幣業務提供服務的機構和個人。 WEEX Crypto News, 2026-01-06 10:08:53 中國對實體資產代幣化的嚴厲執法 近日,中國的七個主要金融協會一起發表了一則重磅聲明,宣告實體資產(RWA)代幣化為非法金融活動,這樣的舉動再一次強化了其對加密貨幣交易的全面禁令。此聲明顯示,中國互聯網金融協會、中國銀行業協會、中國證券業協會、中國資產管理協會、中國期貨業協會、中國上市公司協會以及中國支付清算協會紛紛警告國內外的從業者,RWA活動在中國法律下並無任何運營的法律依據。 該聲明中將RWA活動與穩定幣、”無價值的加密貨幣”及挖礦活動一起,列為非法虛擬貨幣活動的主要表現,這導致RWA被認為是一種高風險且具有欺詐性的經營方式,而非一種等待監管澄清的新興金融技術。 實體資產代幣化:處於證券法管制下的融資活動 聲明明確指出,實體資產代幣化是指“通過發行代幣或其他具有代幣特徵的權利和債務工具進行的融資和交易活動”,此類行為帶有“虛構資產的風險、商業失敗風險和投機風險”。監管機構強調,“我國的金融監管部門並未批准任何實體資產代幣化活動”,從而消除了任何項目聲稱處於監管探索階段或等待註冊批准的可能性。 這一立場與新加坡等2025年RWA採用全球領先的國家有所不同。官方特別列舉了三項與現行中國法律相關的關鍵違規行為。向公眾發行代幣的項目,並同時籌集資金將面臨非法集資指控,而未經許可進行交易或分發代幣則構成未經授權的公開證券發行。涉及槓桿交易或投機機制的代幣交易可能構成非法期貨業務操作,這些定性直接源於中國刑法和證券法的條款,而非一般性的政策警告。 根據文件,RWA代幣結構無法保證合法的資產所有權或基本資產的清算,不論項目團隊是否認為其資產是真實的且技術透明,監管機構判斷即便是合規的項目,風險的延伸也是不可控的。 此外,中國證券監管機構正暗示國內券商在香港的RWA代幣化業務應當停止。…

加密市場隨著資本部署而上升,聚焦美國就業數據:雷射數位
核心要點 2026年1月起,加密市場迎來穩健起點,由於資本再度投入及市場情緒改善,使得比特幣及以太幣價格上揚。 亞洲市場的交易時段顯示強勁表現,然而美國時段的跟進力度較弱,成為市場密切關注的信號。 本週的美國勞動市場數據,包括非農就業報告,將成為市場的焦點,影響投資者對於宏觀經濟的預期。 整體加密資產的基本面依然穩固,市場情緒相對積極,但地緣政治風險依然是潛在威脅。 WEEX Crypto News, 2026-01-06 10:09:45 在新的年度伊始,加密貨幣市場展示出一段特別的成長,這無疑是由多種因素驅動的。比特幣與以太坊以顯著的漲幅迎接2026年,其中的主要推動力便是受到資本重新投入的影響,以及市場情緒的顯著改善。據雷射數位(Laser Digital)的最新市場評論指出,這種上升趨勢主要反映了年末動態因素和市場新倉位的結果。 年後資金流入推動市場上升 在過去的週末,比特幣的價格從87,000美元攀升至93,000美元,而以太坊則從約2,970美元上升到3,200美元。不久前,比特幣交易價格維持在92,966美元左右,24小時內上漲約1.8%,延續了其在波動的12月後的早期回升趨勢。雷射數位指出,這一動作可能反映了年末的市場動態和新的交易定位。今年1月,隨著稅務損失收割導致的12月賣壓消退,新資金重新流入市場。 2026年1月2日,現貨比特幣ETF出現資金流入,顯示機構需求也恢復跡象。這改變了12月份不斷外流的趨勢,增強了市場看漲的情緒。衍生品活動也反映了這樣的趨勢,年末期權交易桌顯示有約3,000份1月底到期的比特幣看漲期權在12月最後一天交易,顯示市場對於比特幣價格在2026年初走高的預期。 亞洲市場引領,交易者關注美國市場動向 近期的價格走勢遵循了熟悉的模式:亞洲交易時段表現強勁,而美國時段則顯示出較弱的回響。雷射數位表示,這一動態的任何轉變都將是市場的重要信號。若美國市場出現數次強勢交易日,可能會將觀望的投資者吸引回風險資產的懷抱。從技術角度看,比特幣的95,000美元被視為關鍵阻力位,一旦突破該區域,可能會引發進一步的上行動能,而若未能突破,價格可能在近期內保持震盪。 就業數據成市場焦點…

Starknet主網再次停擺:以太坊L2凍結超過兩小時
重要要點 Starknet是一個基於零知識卷積的以太坊Layer-2系統,最近發生了超過兩小時的主網中斷。 雖然Starknet擁有強大的鏈上數據和指標支持,但這次中斷仍然有效地暫停了所有鏈上活動。 Starknet過去一年中出現多次網絡中斷,使人質疑其穩定性和去中心化進程。 市場對此次中斷的反應不大,STRK代幣價格輕微上升。 WEEX Crypto News, 2026-01-06 10:09:45 Starknet的運作中斷最新詳情 最近,Starknet,一個基於以太坊的零知識卷積Layer-2系統,再次遭遇了主網中斷,這讓它的運行穩定性備受質疑。這次中斷發生在星期一,持續超過兩個小時,期間網絡操作完全停止。開發者通過平台X發布消息,表示正在積極調查問題並努力恢復網絡的完全功能。然而,當下並沒有直接的解釋說明這次中斷的具體原因。 當中斷初次更新時,區塊生產已停止超過兩個小時,使用者無法提交或確認交易。這顯然對於依賴於Starknet進行交易和智能合約運行的用戶造成了影響。 Starknet鏈上活動的前景 無論如何,Starknet本身擁有強大的指標支持。在運行初期,其區塊瀏覽器顯示,該網絡自啟動以來處理了超過2.64億筆交易,支持超過5.6萬個活躍賬戶,平均交易費用不到一分錢。此系統的總鎖定價值約為8.4億美元。然而,儘管擁有這些數據和資源,這次主網的中止仍然暫停了去中心化應用程序、錢包和智能合約的所有活動。 Starknet的設計目標是將交易批量處理後提交至以太坊,並提交加密證明來擴展去中心化金融、遊戲和其他智能合約用例,同時依賴於以太坊的結算和安全。在這一點上,它已成為推動以太坊生態系統中BTCFi擴張的重要橋樑。 然而,其網絡在最近的中斷打亂了這些計劃,至少暫時中止了不斷探索的去中心化金融相關功能。與此同時,開發者和用戶仍在等待正常運行的恢復。 累積的網絡中斷模式…

暗死的膜稅幣重獲生機:壓力後強勢反彈
關鍵要點 膜稅幣市值在2026年年初增加超過80億美元,其市佔率自2025年12月的歷史低點迅速反彈。 以PEPE為首的主流膜稅幣年初至今已錄得顯著的雙位數增幅,交易量突破90億美元。 減低的比特幣波動性為膜稅幣吸引資金流入創造了空間,而交易者的恐慌性買入進一步推動了市場的上行勢頭。 根據歷史模擬,2026年膜稅幣市場可能會重現2021年的繁榮,市值有望在第一季度達到690億美元。 WEEX Crypto News, 2026-01-06 10:09:51 在歷經2025年12月的低迷之後,膜稅幣正重新從市場的底部逐漸崛起。這次重生的現象改寫了市場預期,使得過去被視為投機標的的膜稅幣,如今再度回到投資者的聚光燈下。在此一過程中,膜稅幣的市場份額從歷史低點快速回升,促使投資者重新關注這些風險較高的資產。 市場在假期後強勢回彈 市場研究數據顯示,在2025年12月,膜稅幣在其他加密資產市場的主導權降至3.2%,相較2024年11月的11%幾乎縮水三分之二。不過,自2026年年初以來,這一板塊已經增添了超過80億美元的市值,主流膜稅幣出現了令人震驚的雙位數增長。其中,以PEPE的表現最為突出,其年初至今已漲幅達65%,在24小時內單日拉升34%。 同時,BONK和FLOKI等膜稅幣亦分別上漲了49%和40%。這一輪反彈開始於假期結束后,當時交易員通常會持保守立場。然而,比特幣波動性的降低,同時打開了膜稅幣吸引資本的空間。以比特幣為例,在年初突破90,000美元後,近期交投於93,000美元區間。此外,狗狗幣亦在多年的下降趨勢中突破,周漲幅超過20%,而柴犬幣則上漲18.9%。 平台優勢驅動復甦 據Messari的報告,Pump.fun主導了Solana生態系統中的代幣發行,佔據了高達70-77%的新代幣發行量以及每日網絡交易的25%。自2024年初以來,該平台已有超過1,300萬個代幣創建,佔Solana所有代幣的三分之一以上。該平台在生命周期收入方面創下了超過8.66億美元的記錄,其收入幾乎全數用於代幣回購,從而減少了約8%的PUMP流通供應。 儘管有新的競爭者出現,但獨立的膜稅幣依然控制著總市值的86.2%,這顯示出草根發行在社區支持方面擁有更強的黏着性。在這個市場中,狗狗幣類的膜稅幣占據了39.5%的主導地位,而青蛙和貓類代幣如PEPE、POPCAT和MEW也吸引了相當多的關注。地理上的關心度依然集中在美國,其佔據了2025年11月30%的膜稅幣相關信息瀏覽量,比年初的20%有顯著提升。 分析師參攷歷史模式提供指引…
Ledger 再次遭受資料洩露——客戶姓名和聯繫方式暴露
鑄幣平台 Ledger 再次遭遇資料洩露事件,涉及客戶個人信息及聯繫方式的外洩。 這次事故出自於支付處理商 Global-e 的遭受攻擊,並未涉及支付卡信息及 Ledger 硬體錢包的核心安全。 該事件增加了針對 Ledger 客戶的網路釣魚與社會工程攻擊的風險。 在此之前,Trust Wallet 和 MetaMask 也遭遇類似攻擊,整個加密貨幣生態系統的用戶正面臨著高度緊張的安全形勢。 WEEX Crypto…
Sui 加密貨幣價格預測:SUI 價格預計將于2026年1月10日下跌至$1.31
主要收穫 Sui 加密貨幣最近價格呈上漲趨勢,但市場情緒仍然看跌。 技術指標顯示SUI價格可能會在未來五天內下跌23.27%。 SUI在過去30天內已上漲21.80%,目前交易價格高於50日和200日簡單移動平均線。 投資者情緒指標「恐懼與貪婪指數」顯示市場仍處於恐懼狀態,暗示有潛在購買機會。 WEEX Crypto News, 2026-01-06 10:06:51 隨著加密貨幣市場的廣泛波動,Sui 加密貨幣(Sui Crypto)近期的市場表現引起了投資者的極大關注。根據CoinCodex的技術分析,SUI的價格預計將於2026年1月10日下跌至1.31美元,相比現價1.88美元,這意味著未來五天SUI將下跌23.27%。 最近Sui 加密貨幣的市場表現 在過去的30天裡,Sui 加密貨幣呈現出積極的走勢,價格上漲達21.80%。然而,從中長期來看,SUI表現並不理想,過去3個月下降了45.82%,與去年同期相比下降了63.98%。Sui…
Kaspa價格預測:KAS價格到2026年1月9日將下跌至$0.038894
關鍵要點 Kaspa在未來五天預計將下降23.35%,預測價格達到$0.038894。 目前的市場情緒偏向看跌,恐懼與貪婪指數顯示極度恐懼。 KAS在最近30天顯示負面趨勢,價格下降了4.48%。 技術分析指標大多中性,但長期移動平均線顯示出看漲信號。 WEEX Crypto News, 2026-01-06 10:06:55 Kaspa現狀與未來展望 Kaspa(KAS)是一個受投資者密切關注的加密貨幣,其未來走勢在近期更是備受市場熱議。根據Kaspa的價格預測,KAS可能在未來五天內下跌至$0.038894,這將代表著一個-23.35%的價格下降。這一趨勢不僅反映出當前加密貨幣市場的波動性,也顯示出投資者對於Kaspa未來發展的謹慎態度。 在撰寫本文時,Kaspa的交易價格為$0.051824,過去24小時內增長了5.18%,相較於整個加密市場3.52%的增長率,表現出色,同時也相比於比特幣取得了3.28%的優勢。然而,總體市場情緒仍保持在極度恐懼(25)的水平,顯示出投資者的參與度較低,市場觀望情緒濃厚。 Kaspa的近期表現 在最近的30天中,Kaspa的價格整體走勢呈現下降趨勢,跌幅達到4.48%。從中期來看,Kaspa的表現更加悲觀,過去三個月中價格下降了34.90%。1年期的長期趨勢同樣不容樂觀,比起去年同期KAS的交易價格$0.127541,如今的下跌幅度達到了59.37%。2024年8月1日Kaspa達到歷史價格高點$0.208892,而現今價格的高位和低位分別是$0.066494和$0.020431,顯示出近半年來Kaspa的市場波幅。 這段時間Kaspa的市場波動性下降,最近一個月的波動率大約為6.27%,這意味著市場的劇烈波動有所減緩。這段時間中,Kaspa有13天的交易日錄得正增長,表明某些情況下仍存在獲利機會。 技術分析與市場情緒 Kaspa的技術分析表明,目前市場情緒普遍偏向看跌。在技術指標中,有12個顯示出看漲預測,而14個顯示出看跌預測,54%的指標傾向於負面預測,這使得市場對Kaspa的整體預期變得較為謹慎。…
以太娜價格預測:ENA價格預計將降至$0.192294於2026年1月11日前
重點摘要 當前以太娜價格為$0.249202,在未來五天內可能下降23.08%。 市場情緒呈現看跌狀態,恐懼與貪婪指數為44,顯示市場普遍存在恐懼。 本月以來,以太娜的價格波動性高,過去30天有16天價格上升。 關鍵支撐點分別在$0.242274、$0.231037和$0.222901;主要阻力位於$0.261648、$0.269784及$0.281021。 技術分析指出,雖有少數指標表現看多,但總體上68%的指標持看空預測。 WEEX Crypto News, 2026-01-06 10:06:52(today’s date,foramt: day, month, year) 頗具投機性的加密貨幣市場中,價格預測和走勢分析一直備受投資者關注。以太娜(Ethena,ENA)的價格在近期吸引了眾多目光,根據市場數據顯示,ENA的價格預計將在未來幾日內下降約23.08%,降至$0.192294。這一預測激發了市場中對該貨幣的關注及討論。 以太娜近期市場表現 以太娜目前的交易價格為$0.249202,過去24小時內價格上升了3.27%。這個漲幅在一定程度上優於整體加密市場的2.01%上升率。此外,相較比特幣(BTC),ENA當日前進了1.94%,顯示出相對較好的表現。然而,若將當前價格與過去30天相比,以太娜錄得-4.77%的跌幅,更長期來看,於過去三個月內下滑了-53.74%,而整體一年內更是驟降79.96%。…
木星幣價預測——JUP價格預計至2026年1月9日跌至$0.165879
關鍵要點 木星幣(JUP)價格預期在接下來五天內下降23.33%。 當前的價格為$0.217225,比特幣表現出色。 最近30天木星幣呈現負向趨勢,並在過去三個月內下跌54.07%。 市場情緒當前偏向熊市,恐懼與貪婪指數顯示為極度恐懼。 WEEX Crypto News, 2026-01-06 10:06:54 在加密貨幣市場中,木星幣(JUP)的價格表現和預測不容忽視。在本文中,我們將深入分析JUP在未來幾天的價格變動及其潛在的市場走向。本文中所使用的數據來自於過去的市場表現以及多項技術分析指標的結果。 木星幣的現狀與未來預測 截至目前,木星幣的交易價格為$0.217225,經過過去24小時的市場波動後,這一價格已提升4.13%。相較於整體加密市場的平均增長4.49%,木星幣顯得尤其突出。與比特幣相比,JUP今日也獲得了3.21%的提升。 然而,根據市場預測,JUP的價格很可能在未來五天內下滑至$0.165879,這將代表著23.33%的降幅。同時,木星幣在過去30天內已經下跌了4.70%,中期走勢呈現熊市,不容小覷。在過去一年,JUP顯示出77.10%的價格變化,這突出了其在市場中的不穩定性。 近三十天的木星幣走勢 在過去的一段時間裡,木星幣一直表現不佳。這段期間內它不僅失去了價值,也顯露出其波動性相對較低的特點。1個月的波動率達到8.64,讓投資者小心謹慎。今年木星幣的最高價出現在4月1日,當時達到$1.84的高點。而目前的周期高點為$0.221866,低點則為$0.168834。 值得注意的是,市場上的蜂巢情緒指數為25,這意味着投資者情緒非常不安,普遍呈現極度恐懼的狀態。這種產品心理指數的顯示常常預示著潛在的買入良機。 木星幣的技術分析…
Polymarket 發佈房地產市場預測 – 加密交易者現可投機房價
Key Takeaways Polymarket 與 Parcl 合作,讓加密交易者能不擁有房產卻可參與房地產市場價格預測。 用戶可根據大都會區的房價指數變動,交易房價指數上升或下降的合約。 這一新類別將房地產引入 Polymarket 已經涵蓋的大型預測市場中,如選舉、體育和宏觀經濟指標。 透過與 Parcl 的合作,市場解決僅憑明確且可驗證的數據進行結算的要求。 WEEX Crypto News, 2026-01-06 10:07:43…
Worldcoin 被預測在2026年1月11日跌至 $0.483911
主要見解 Worldcoin 預測價在未來五天將下降23.12%,至 $0.483911。 近期市場情緒顯示,目前對 Worldcoin 的看法偏向看跌。 前50天和200天的移動平均線表明市場趨勢呈看漲。 目前的恐懼與貪婪指數顯示投資者的市場展望偏負面。 加密市場的波動性令 Worldcoin 的長期價格預測充滿挑戰。 WEEX Crypto News, 2026-01-06 10:06:52 Worldcoin…