- Krypto kaufen
- Märkte
- Futures
- Spot
- Copy-Trade
 WE-Launch
Is the Discrepancy in CEX Liquidity Data Signaling a Larger Issue?
Original Title: Liquidations, liquidations everywhere!
Original Author: threesigmaxyz Original Translation: zhouzhou, BlockBeats
Editor's Note: This article explores the significant discrepancy between the liquidation data reported by centralized exchanges (CEX) and actual liquidation activities. By comparing Hyperliquid's transparent liquidation data with CEX reported data, it reveals that CEX may underreport liquidation data to mask market volatility or manage public perception. The article also emphasizes the importance of transparency in understanding market risk and systemic risk, and points out that exchanges like Bybit are taking more open approaches to releasing liquidation data, driving the industry towards greater transparency.
Below is the original content (reorganized for easier reading comprehension):
Traders getting liquidated, billions evaporating. But what if the actual liquidation figures were 19 times higher than reported? We dug into the data, and the results are worse than you might think.
1. Liquidation
The world of trading has become increasingly accessible to the average person, whether through the glamorous courses of so-called "gurus" or as an alternative to traditional work, trading offers the temptation of earning a substantial income from the comfort of one's home, through a computer.
However, this is far from easy, and if it were that simple, everyone would succeed. In fact, most people who enter trading end up losing money and eventually blowing up their accounts. So, what causes these losses? Usually, all of this boils down to a pivotal event that every trader fears: liquidation.
Liquidation is a key mechanism in leveraged trading, where a trader's margin is insufficient to cover the losses of an open position, resulting in liquidation. In this scenario, the exchange will intervene, automatically closing the position to ensure that the trader or platform no longer incurs further losses.
Depending on the severity of the margin shortfall and the platform's risk management mechanisms, liquidation can take different forms. These forms can be roughly divided into two types:
· Partial Liquidation: Involves reducing part of the trader's position, while the remaining part remains active. This allows the trader to stay in the market, while reducing the associated risk.
· Full Liquidation: The entire position is liquidated, completely eliminating the trader's exposure risk. Full liquidation is more common in high leverage environments, as in such environments, even slight price movements can completely wipe out a trader's margin.
The Key Factors Behind Liquidation
There are multiple factors contributing to liquidation, all revolving around the delicate balance between risk and margin:
· Leverage: Leverage allows traders to control larger positions with less capital, but this potential for amplified profits comes with higher risk. The higher the leverage, the smaller the price swing needed to trigger liquidation. For example, with 50x leverage, a price movement of just 2% against the position would lead to the complete loss of margin. This underscores the critical importance of risk management in leveraged trading.
· Maintenance Margin: Every exchange sets a minimum margin requirement that traders must maintain to keep a position open, serving as a safety buffer. When losses cause the margin to fall below this threshold, the exchange will liquidate to prevent further losses. Ignoring or failing to monitor these requirements can quickly lead to forced liquidation.
· Market Volatility: Sudden and extreme price swings are a trader's greatest enemy, especially in highly leveraged positions. Volatility can rapidly deplete available margin, leaving traders with little time to react. Moreover, periods of high volatility often trigger a cascade of liquidations, where one liquidation sets off a series of others, further driving prices in the wrong direction.

Squeeze
A squeeze is one of the most intense and rapid triggering factors for liquidation, usually occurring during sharp price movements that force counter-traders in the market to close their positions. These events are typically driven by high leverage and low liquidity, forming a snowball effect that accelerates price swings and exacerbates market volatility.
When prices surge rapidly, traders holding short positions find themselves in trouble as their margin is insufficient to support the trade. To avoid further losses, they are forced to buy back assets to close their positions, adding more upward pressure on the price. This dynamic often quickly evolves into a series of liquidation events, where one trader's closure drives the price up, forcing others to liquidate as well.
Conversely, when prices suddenly plummet, traders with long positions also face the same risk. As their margin shrinks, they are forced to sell off their positions to meet maintenance margin requirements, further intensifying the downward momentum. This selling pressure amplifies the price drop, triggering more liquidation events and forming a downward spiral.
However, coordinated retail buying, especially initiatives like the one seen on Reddit's WallStreetBets community, caused stock prices to unexpectedly soar. As the price rose, short sellers were forced to buy back the stock, driving the price higher and further fueling the upward momentum.
This feedback loop eventually evolved into a historic event, with GameStop's stock price soaring from around $20 in early January 2021 to an intraday high of $483 by the end of the month. This squeezing event led to many institutional investors who were in short positions losing billions of dollars.

2. API and Liquidation Events
In the cryptocurrency space, there have been several notable liquidation events in history. However, the most memorable and impactful ones often occur during a bear market's "short squeeze." These events are larger in scale and have a more profound impact on traders and the market.
Here are some of the biggest liquidation events in cryptocurrency history:

Notice anything unusual, anon? Do you think the FTX collapse or Luna crash did more damage than the liquidation events we've seen this year? Well, you're not wrong.
Behind the recent liquidation events being more severe than the FTX or Luna collapses are three key factors:
Total Market Capitalization
In March 2020, the total market cap reached $2.66 trillion, and by 2025, the peak market cap had reached $3.71 trillion. To truly understand the scale of these liquidation events, we should consider the ratio of liquidations to market cap rather than just looking at the absolute numbers of liquidations. Raw numbers can make recent liquidations seem more severe than they actually are.

This chart helps us see the scale and impact of liquidations more clearly, but there's still some data that isn't quite accurate; this leads to the second issue.
CEX WebSocket API Limitations
Until the second quarter of 2021, most centralized exchanges (CEX) provided accurate liquidation data via their APIs, reporting each liquidation. However, starting in 2021, they introduced limitations, restricting liquidation data to one per second, regardless of how many actual liquidations occurred.
This change significantly reduced the reported liquidation numbers, making the data from late 2021 appear smaller and less impactful compared to before 2021.
@K33Research has written a research article explaining this situation and illustrated it through two simple yet powerful charts:
In the first chart, you can see that after the API changes, the number of liquidations has significantly slowed down, even though the total market value is much higher than in 2021, the liquidation data remains at a lower level.

In the second chart, the author compares the total liquidation amount with the daily nominal Open Interest (OI) change.
The substantial intraday fluctuations in Open Interest usually trigger a large number of liquidations, but as we can see in the chart, after the second quarter of 2021, on days with such significant OI fluctuations, there was no notable increase in liquidations.

The official reasons behind these API changes are: "to provide a 'fair trading environment' (Bybit, September 2021) and to 'optimize user data flow' (Binance, April 2021)," but some believe that this is actually just for PR reasons to avoid causing excessive panic while also retaining genuine data.


Hyperliquid as a Genuine Platform
Hyperliquid is the first Layer 1 blockchain perpetual DEX to reach sufficient trading volume to compete with CEX. Unlike CEX, Hyperliquid provides fully transparent and unrestricted reporting of all liquidation events since its data is public.
This creates a unique environment where, on one hand, CEX's liquidation data is limited (due to reporting restrictions), while on the other hand, Hyperliquid's data is unrestricted. As a result, the reported total liquidation data has significantly increased, benefiting from Hyperliquid's transparency.
This transparency has a significant impact on the broader trading ecosystem. In traditional centralized exchanges, liquidation data is often selectively reported or summarized, limiting traders' ability to analyze market dynamics in real-time. Hyperliquid ensures that every liquidation event is publicly visible, providing a more accurate and comprehensive understanding of leverage trading activities.
For traders, this means a better understanding of the market situation, enabling them to identify potential squeeze scenarios, monitor risk levels, or gauge market sentiment. Researchers and analysts have also benefited from unfiltered on-chain liquidation data, providing valuable insights into volatility patterns, risk behavior, and market reactions to liquidations.
This unrestricted access to data has promoted a more equitable, efficient trading environment where all participants have equal access to information. By setting new transparency standards for perpetual trading, Hyperliquid has not only challenged the opacity of CEXs but has also enhanced the overall reliability of liquidation data, allowing traders to operate with greater trust and deeper market insights.
3. Real Liquidation Data
3.1 Calculating the Hyperliquid Ratio
Hyperliquid's transparency and comprehensive metrics allow us to see what has been happening over an extended period, whereas the derivative segments of CEXs have not been able to report real-aligned figures due to API limitations. The data discrepancies seen in the charts further confirm this issue, showing that despite CEXs having much larger open interest contracts and volumes compared to Hyperliquid, their reported liquidation figures are still unrealistically low.
Thanks to Hyperliquid, we now have a verifiable and accurate dataset to compare the distortion in CEX liquidation reports.
The data provided to the media often presents an incomplete picture as they are based on limited APIs, failing to capture the full extent of liquidation events. In contrast, Hyperliquid's unrestricted reporting offers transparent and detailed records of all liquidation events, proving that CEX liquidation activity may be significantly higher than publicly disclosed figures.


3.2 Adjusting CEX Liquidation Data Using the Hyperliquid Ratio
To estimate CEX's "true" liquidation figures, we used Hyperliquid's liquidation/trading volume ratio and liquidation/open interest ratio as benchmarks. We then compared these ratios to the data reported by CEXs on two specific dates (December 9 and February 3), resulting in an adjustment factor.
Calculate Hyperliquid's Average Ratios:
Liquidation / Open Interest (Hyperliquid)
Dec 9: 1.07B / 3.37B ≈ 0.3175
Feb 3: 1.42B / 3.08B ≈ 0.461
Average ≈ 0.389 (38.9%)
Liquidation / Trading Volume (Hyperliquid)
Dec 9: 1.07B / 5.30B ≈ 0.2021
Feb 3: 1.42B / 18.0B ≈ 0.0789
Average ≈ 0.14 (14%)
We use these percentages (38.9% and 14%) as reference points to assess what the liquidation data might look like if other exchanges were to follow a similar ratio to Hyperliquid.
Applying These Ratios to Binance, Bybit, and OKX:
For each CEX, we calculate two "adjusted" liquidation data:
Using Hyperliquid's Liquidation/Trading Volume Ratio
Using Hyperliquid's Liquidation/Open Interest Ratio
Then, we take the average of these two adjusted results for each date.

Therefore, the CEX-reported liquidation data (often in the range of billions of dollars) is significantly lower than the implied billion-dollar range based on the Hyperliquid ratios.
Below are the reports and adjusted liquidation data charts for Dec 9 and Feb 3. Each exchange has two bar graphs, with light blue and light green representing the reported liquidation data and dark blue and dark green representing the adjusted liquidation data.
The adjusted values are calculated by taking the average of the Liquidation/Trading Volume ratio and the Liquidation/Open Interest ratio from Hyperliquid as the baseline. While this provides a clearer perspective on potential liquidation data differences, variations may still exist due to differences in exchange market structure, retail participation, liquidity provider activity, etc.

Key Insights:
Liquidation data from Binance, Bybit, and OKX is significantly underreported: The reported liquidation data (light blue/light green) is much lower than the adjusted data (dark blue/dark green), indicating that the actual liquidation data may be much higher than publicly disclosed numbers.
Binance should report approximately 17,640M in liquidation data: The adjusted data suggests that Binance's actual liquidation data on February 3 should be close to 17,640M, rather than the reported 611M, highlighting a significant discrepancy. On December 9, Binance should report 10,020M instead of 739M.
Bybit and OKX follow a similar pattern: Bybit's adjusted liquidation data on February 3 is 8,150M, not 247M as reported; on December 9, it is 4,620M instead of 370M. OKX also shows significant differences, with adjusted liquidation data of 7,390M on February 3 and 3,980M on December 9, compared to reported figures of 402M and 425M, respectively.
3.3 Major Liquidation Events and their "True" Estimates
After comparing Hyperliquid's liquidation data with the limited data reported by major CEXs, we found significant variances. To quantify this difference, we collected reported data from Binance, Bybit, and OKX on December 9 and February 3, specifically analyzing their liquidation/trading volume and liquidation/open interest ratios.
To estimate the true liquidation data, we calculated the average ratio of Hyperliquid's liquidation/trading volume and then applied these ratios to CEX data. We did not use a simple arithmetic average but instead calculated the liquidation ratios weighted by the proportion of each exchange's trading volume on each date. This method offers a more accurate reflection of overall market liquidation activity.

When we initially calculated the adjustment factors for each exchange (Binance: 21.19, Bybit: 22.74, OKX: 13.87), a simple average yielded a global adjustment factor of 19.27x. However, considering the weighted differences in exchange volumes, the more precise weighted average is 19.22x.
This indicates that the actual settlement data from CEXs may be roughly 19 times higher than what is officially reported, or at least 19 times higher than the data disclosed through their restrictive APIs.
With this 19.22x adjustment factor in mind, we analyzed some significant settlement events in the history of crypto to estimate how much their actual settlement data might be if they had the same level of transparency as Hyperliquid. The table below compares common settlement amounts to the values adjusted by the 19.22x factor:

“Reported” refers to the figures published on aggregators, social media, or limited APIs.
For events prior to Q2 2021, settlement data is much more reliable due to the absence of API restrictions.

As highlighted in this chart, the settlement figures derived from data sources reported post-2021 may significantly underestimate the true picture. By applying the multiplier derived from Hyperliquid's full transparency, the settlement scales of these events are much larger than what the official figures assume.
3.4. Comparing Settlement to Total Market Cap
To provide more context, we compare the total “true” settlements of these events to the total market cap at the time. The ratio calculation formula is: (Settlement Amount / Market Cap) × 100.


By comparing the “true” settlement data to the broader cryptocurrency market cap, we can gain a deeper understanding of the impact of each event on market dynamics. This not only demonstrates the scale of capital that vanished in a short period but also reflects how market sentiment drastically changed when leverage effects were unwound.
In many cases, the ratio becomes more pronounced after adjustment, indicating that participants may have been exposed to greater systemic risks than initially apparent. Therefore, understanding these settlement-to-market cap ratios can provide a clearer perspective to help us grasp how market psychology and liquidity conditions shift during periods of extreme volatility.
4. Conclusion
From all the preceding data and comparisons, a pattern emerges clearly: the figures reported in CEX public disclosures are often significantly lower than the "true" settlement activity. When adjusted to match the Hyperliquid transparent ratio, events like the Luna and FTX collapses have revealed a larger impact than what official data suggests, further reinforcing the view that CEXs may underreport settlement data to mask volatility or manage public perception.
This contrast becomes even more pronounced when looking at historical events: the COVID crash of 2020, while a major market event at the time, now appears relatively minor precisely because there were fewer leveraged participants then. With the mainstreaming of leverage, settlement's absolute and relative scale continues to grow, but the constraints of official data flows may give traders and analysts a distorted view of systemic risk.
Furthermore, exchanges often cite "optimizing data flow" or "ensuring fair trading conditions" as reasons, but it is not hard to see that restricting the real-time release of settlement data can serve broader interests. Underreporting settlement data can reduce the fear of new retail investors while also allowing exchanges to gain exclusive insights into market-wide risk exposure.
While these measures may help narrow the gap between reported data and actual settlement activity, Hyperliquid's reliance on on-chain, unrestricted reporting still highlights how crucial true transparency is for anyone looking to navigate leveraged crypto trading.
Das könnte Ihnen auch gefallen

WEEXPERIENCE Whales Night: KI-Handel, Krypto-Community und Krypto-Markteinblicke
Am 12. Dezember 2025 veranstaltete WEEX die WEEXPERIENCE Whales Night, ein Offline-Gemeinschaftstreffen, das lokale Kryptowährungs-Communitymitglieder zusammenbringen sollte. Die Veranstaltung kombinierte Content Sharing, interaktive Spiele und Projektpräsentationen, um ein entspanntes und dennoch ansprechendes Offline-Erlebnis zu schaffen.
AI Trading Risk in Kryptowährung: Warum können bessere Krypto-Handelsstrategien größere Verluste verursachen?
Risiko sitzt nicht mehr in erster Linie in schlechten Entscheidungen oder emotionalen Fehlern. Sie lebt zunehmend in Marktstruktur, Ausführungswegen und kollektivem Verhalten. Diesen Wandel zu verstehen ist wichtiger als die nächste „bessere“ Strategie zu finden.

KI-Agenten ersetzen Kryptoforschung? Wie autonome KI den Kryptohandel verändert
KI entwickelt sich von der Unterstützung von Händlern zur Automatisierung des gesamten Research-to-Execution-Prozesses in Kryptomärkten. Der Vorsprung hat sich von menschlichen Erkenntnissen hin zu Datenpipelines, Geschwindigkeit und ausführungsbereiten KI-Systemen verlagert, wodurch Verzögerungen bei der KI-Integration zu einem Wettbewerbsnachteil werden.

AI Trading Bots und Copy Trading: Wie synchronisierte Strategien die Volatilität des Kryptomarktes verändern
Krypto-Händler im Einzelhandel stehen seit langem vor denselben Herausforderungen: schlechtes Risikomanagement, späte Einstiege, emotionale Entscheidungen und inkonsequente Ausführung. KI-Handelstools versprachen eine Lösung. Heute helfen KI-gestützte Copy-Trading-Systeme und Breakout-Bots Händlern, Positionen zu vergrößern, Stopps zu setzen und schneller als je zuvor zu handeln. Über Geschwindigkeit und Präzision hinaus verändern diese Tools die Märkte im Stillen – Trader handeln nicht nur intelligenter, sie bewegen sich synchron und schaffen eine neue Dynamik, die sowohl Risiken als auch Chancen verstärkt.
AI Trading in Crypto Erklärt: Wie autonomer Handel Kryptomärkte und Kryptobörsen verändert
KI-Handel verändert die Krypto-Landschaft rasant. Traditionelle Strategien haben Schwierigkeiten, mit der Nonstop-Volatilität und komplexen Marktstruktur von Krypto Schritt zu halten, während KI massive Daten verarbeiten, adaptive Strategien generieren, Risiken managen und Trades autonom ausführen kann. Dieser Artikel führt WEEX-Nutzer durch, was KI-Handel ist, warum Krypto seine Einführung beschleunigt, wie sich die Branche hin zu autonomen Agenten entwickelt und warum WEEX das KI-Handelsökosystem der nächsten Generation aufbaut.

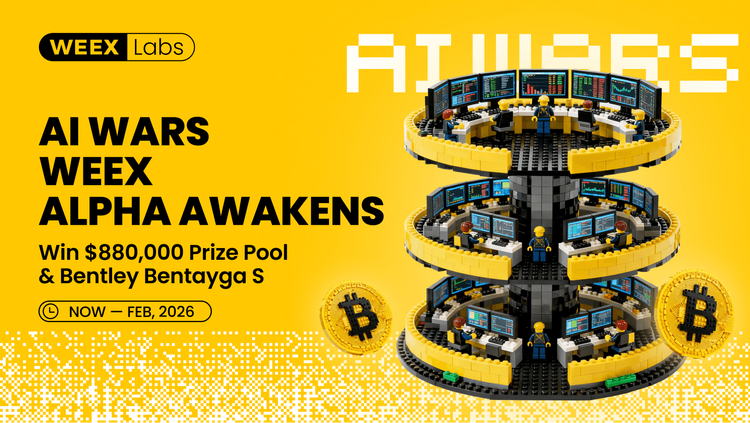
Aufruf zur Teilnahme an AI Wars: WEEX Alpha Awakens — Globaler KI-Handelswettbewerb mit 880.000 US-Dollar Preispool
Jetzt rufen wir KI-Händler aus aller Welt dazu auf, sich AI Wars anzuschließen: WEEX Alpha Awakens, ein globaler KI-Handelswettbewerb mit 880.000 US-Dollar Preispool.

AI Trading in Crypto Markets: Von automatisierten Trading Bots zu algorithmischen Strategien
KI-gesteuerter Handel verlagert Krypto von Einzelhandelsspekulationen zu institutionellem Wettbewerb, bei dem Ausführung und Risikomanagement wichtiger sind als Richtung. Da der KI-Handel skaliert, steigen Systemrisiken und regulatorischer Druck, was langfristige Leistung, robuste Systeme und Compliance zu den wichtigsten Unterscheidungsmerkmalen macht.
AI Sentiment Analysis and Cryptocurrency Volatility: Was bewegt Kryptopreise
KI-Sentiment beeinflusst zunehmend die Kryptomärkte, wobei sich Verschiebungen der KI-bezogenen Erwartungen in Volatilität für wichtige digitale Assets niederschlagen. Kryptomärkte neigen dazu, KI-Narrative zu verstärken, so dass sentimentgetriebene Ströme kurzfristig die Fundamentaldaten überwiegen. Zu verstehen, wie sich KI-Sentiments bilden und verbreiten, hilft Anlegern, Risikozyklen und Positionierungsmöglichkeiten in digitalen Assets besser zu antizipieren.

AI Wars: Teilnehmerleitfaden
In diesem ultimativen Showdown werden Top-Entwickler, Quants und Trader aus aller Welt ihre Algorithmen in realen Marktkämpfen einsetzen und um einen der höchsten Preispools in der Geschichte des KI-Kryptohandels konkurrieren: 880.000 USD, einschließlich eines Bentley Bentayga S für den Champion. Dieser Leitfaden führt Sie durch alle erforderlichen Schritte von der Anmeldung bis zum offiziellen Start des Wettbewerbs.
Zentralbankwoche und Kryptomarktvolatilität: Wie Zinsentscheidungen die Handelsbedingungen an WEEX prägen
Zinsentscheidungen großer Zentralbanken wie der Federal Reserve sind bedeutende makroökonomische Ereignisse, die die globalen Finanzmärkte beeinflussen und die Liquiditätserwartungen und die Risikobereitschaft der Märkte unmittelbar beeinflussen. Da sich der Kryptowährungsmarkt weiter entwickelt und seine Handelsstruktur und Teilnehmer reifen, wird der Kryptomarkt schrittweise in das makroökonomische Preissystem integriert.
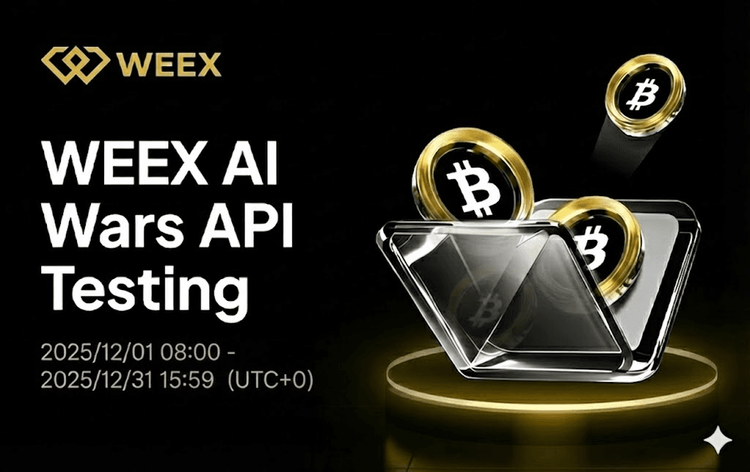
WEEX API Testing: Offizieller Leitfaden für KI Trading Hackathon und Krypto Trading APIs
WEEX API Testing wurde entwickelt, um sicherzustellen, dass jeder Teilnehmer Handelslogik in echte Ausführung umsetzen kann. Alle API-Interaktionen finden auf dem Live-Trading-System von WEEX statt, sodass die Teilnehmer unter authentischen Marktbedingungen und nicht unter Simulationen arbeiten können. Mit einer geringen Einstiegsvoraussetzung ist die Aufgabe sowohl für erfahrene Entwickler als auch für motivierte Anfänger zugänglich und validiert dennoch wesentliche technische Fähigkeiten.
AI Wars: Teilnehmerführung test
Teil 1: Die empfohlene Methode (Cloud-Server)
Für beste Stabilität empfehlen wir dringend die Verwendung eines Cloud-Servers mit statischer öffentlicher IP und Unterstützung für einen unterbrechungsfreien Betrieb rund um die Uhr, wie z. B.: AWS (Amazon Web Services), Alibaba Cloud und Tencent Cloud.
Teil 2: Die alternative Methode (lokaler Computer)
Wenn Sie Ihren Handelsbot über einen PC oder ein Heimnetzwerk ausführen möchten, müssen Sie bestätigen, dass Ihre ausgehende IP-Adresse statisch ist. Eine sich ändernde IP führt zu Verbindungsproblemen.
Sie haben zwei Hauptoptionen, um eine stabile ausgehende IP zu gewährleisten:
Verwenden Sie eine statische IP, die von Ihrem Internet Service Provider (ISP) bereitgestellt wird.Verwenden Sie einen VPN- oder Proxydienst mit einer festen Ausgangs-IP (und stellen Sie sicher, dass das VPN/Proxy konsistent aktiviert ist, ohne Server zu wechseln).Schritte zum Auffinden Ihrer lokalen öffentlichen IP:
Deaktivieren Sie alle VPNs, oder behalten Sie nur das einzelne VPN bei, dessen IP Sie auf die Whitelist setzen möchten.Besuchen Sie whatismyip.com in Ihrem Browser.Die Seite zeigt Ihre öffentliche IPv4-Adresse an.Kopieren Sie diese IP und senden Sie sie an die Whitelist.Hinweis: Die meisten Heim-Breitband-IPv4-Adressen sind dynamisch und können sich periodisch ändern. Es wird dringend empfohlen, eine Cloud-Serverumgebung zu verwenden, um Verbindungsausfälle während des Wettbewerbs zu vermeiden.
1.3 Fehlende Informationen? Wir folgen weiterNachdem Sie Ihre BUIDL eingereicht haben, wird das WEEX-Team Ihre Bewerbung anhand der Wettbewerbsanforderungen prüfen. Der Überprüfungsprozess dauert normalerweise einen Geschäftstag.
Wenn Informationen fehlen oder geklärt werden müssen, wird unser Team Sie über einen der folgenden Kanäle kontaktieren:
DoraHacks NachrichtensystemOffizielles WEEX Messaging-SystemIhre registrierten Kontaktdaten (Telegramm, X, etc.)Bitte halten Sie Ihre Kontaktdaten aktiv und zugänglich.
Sobald Ihr BUIDL genehmigt ist, erhalten Sie Ihr Gewinnspielkonto und den exklusiven API Key, mit dem Sie zur nächsten Stufe übergehen können: API-Test und Modellintegration.
. Bitte lesen Sie die offizielle WEEX API Dokumentation sorgfältig durch: https://www.weex.com/api-doc/ai/intro
2. Verbinden Sie sich mit einem Cloud-Server und führen Sie den untenstehenden Code aus. Sie sollten eine Antwort erhalten, die bestätigt, ob Ihre Netzwerkverbindung ordnungsgemäß funktioniert.
curl -s --max-time 10 "https://api-contract.weex.com/capi/v2/market/time"{"epoch":"1765423487.896","iso":"2025-12-11T03:24:47.896Z","timestamp":1765423487896
2. Verbinden Sie sich mit einem Cloud-Server und führen Sie den untenstehenden Code aus. Sie sollten eine Antwort erhalten, die bestätigt, ob Ihre Netzwerkverbindung ordnungsgemäß funktioniert.
import time import hmac import hashlib import base64 import requests api_key = "" secret_key = "" access_passphrase = "" def generate_signature_get(secret_key, timestamp, method, request_path, query_string): message = timestamp + method.upper() + request_path + query_string signature = hmac.new(secret_key.encode(), message.encode(), hashlib.sha256).digest() return base64.b64encode(signature).decode() def send_request_get(api_key, secret_key, access_passphrase, method, request_path, query_string): timestamp = str(int(time.time() * 1000)) signature = generate_signature_get(secret_key, timestamp, method, request_path, query_string) headers = "ACCESS-KEY": api_key, "ACCESS-SIGN": signature, "ACCESS-TIMESTAMP": timestamp, "ACCESS-PASSPHRASE": access_passphrase, "Inhaltstyp": "application/json", "locale": "en-US" } url = "https://api-contract.weex.com/" # Bitte ersetzen Sie durch die tatsächliche API-Adresse, wenn Methode == "GET": response = requests.get(url + request_path+query_string, headers=headers) return response def assets(): request_path = "/capi/v2/account/assets" query_string = "" response = send_request_get(api_key, secret_key, access_passphrase, "GET", request_path, query_string) print(response.status_code) print(response.text) if __name__ == '__main__': assets()
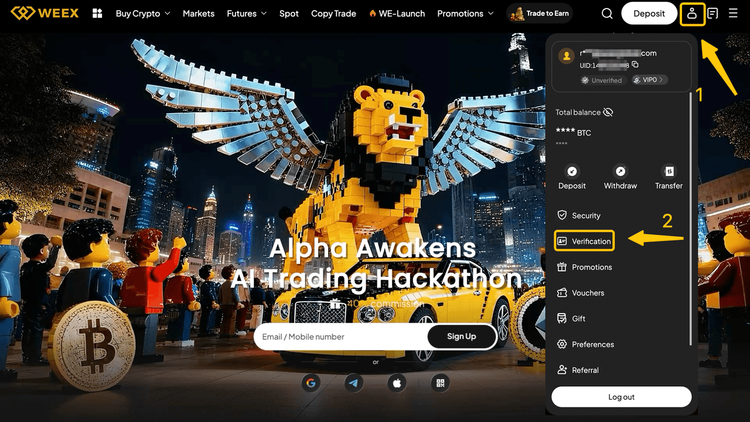
WEEX AI Trading Hackathon Guide: Finden Sie Ihre WEEX-UID und registrieren Sie sich
Bis Februar 2026 veranstaltet WEEX die AI Wars: WEEX Alpha Awakens, den weltweit ersten globalen Krypto-KI-Trading-Hackathon. Melden Sie sich mit Ihrer UID für den WEEX Global AI Trading Hackathon an.
Warum ist WEEX Alpha Awakens der beste KI-Handelswettbewerb 2025? Alles, was Sie wissen müssen
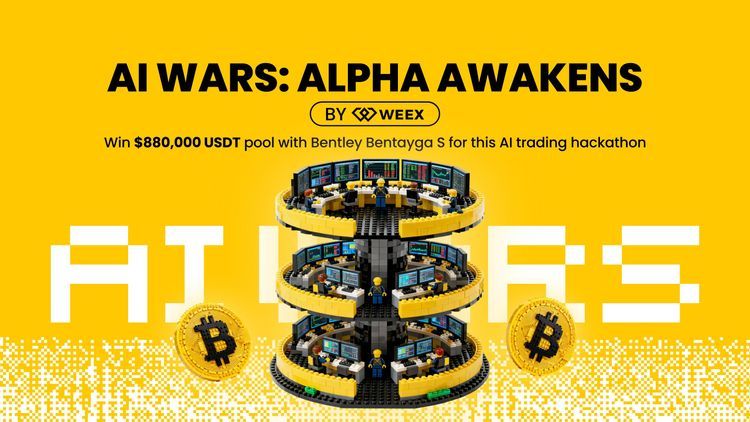
Um die Durchbrüche an der Schnittstelle von KI und Krypto zu beschleunigen, startet WEEX den weltweit ersten globalen KI Trading Hackathon – AI Wars: Alpha Erwacht. Das Event verfügt über einen bahnbrechenden Preispool von mehr als 880.000 US-Dollar, einschließlich eines Bentley Bentayga S für den ultimativen Champion.

AI Wars: WEEX Alpha Awakens | WEEX Global Hackathon API Test Process Guide
AI Wars: Die Registrierung für WEEX Alpha Awakens ist nun geöffnet. Diese Anleitung beschreibt, wie Sie auf den API-Test zugreifen und den Prozess erfolgreich abschließen können.

Was ist WEEX Alpha Awakens und wie kann man teilnehmen? Eine vollständige Anleitung
Um die Durchbrüche an der Schnittstelle von KI und Krypto zu beschleunigen, startet WEEX den weltweit ersten globalen KI Trading Hackathon – AI Wars: Alpha Erwacht.

Der WEEX HODL’em Trading Royale und Dubai Offline Trading Competition erfolgreich abgeschlossen
Am 4. Dezember 2025 veranstaltete die WEEX ihren ersten Dubai HODL’em Trading Royale und Dubai Offline Trading Competition, der die Leidenschaft von AI WARS in die reale Welt brachte.
Beitritt zu AI Wars: WEEX Alpha Erwacht!Global Call for AI Trading Alphas
AI Wars: WEEX Alpha Awakens ist ein globaler KI-Handelshackathon in Dubai, der Quantenteams, algorithmische Händler und KI-Entwickler aufruft, ihre KI-Krypto-Handelsstrategien in Live-Märkten für einen Anteil von 880.000 US-Dollar Preispool freizusetzen.
WEEXPERIENCE Whales Night: KI-Handel, Krypto-Community und Krypto-Markteinblicke
Am 12. Dezember 2025 veranstaltete WEEX die WEEXPERIENCE Whales Night, ein Offline-Gemeinschaftstreffen, das lokale Kryptowährungs-Communitymitglieder zusammenbringen sollte. Die Veranstaltung kombinierte Content Sharing, interaktive Spiele und Projektpräsentationen, um ein entspanntes und dennoch ansprechendes Offline-Erlebnis zu schaffen.
AI Trading Risk in Kryptowährung: Warum können bessere Krypto-Handelsstrategien größere Verluste verursachen?
Risiko sitzt nicht mehr in erster Linie in schlechten Entscheidungen oder emotionalen Fehlern. Sie lebt zunehmend in Marktstruktur, Ausführungswegen und kollektivem Verhalten. Diesen Wandel zu verstehen ist wichtiger als die nächste „bessere“ Strategie zu finden.
KI-Agenten ersetzen Kryptoforschung? Wie autonome KI den Kryptohandel verändert
KI entwickelt sich von der Unterstützung von Händlern zur Automatisierung des gesamten Research-to-Execution-Prozesses in Kryptomärkten. Der Vorsprung hat sich von menschlichen Erkenntnissen hin zu Datenpipelines, Geschwindigkeit und ausführungsbereiten KI-Systemen verlagert, wodurch Verzögerungen bei der KI-Integration zu einem Wettbewerbsnachteil werden.
AI Trading Bots und Copy Trading: Wie synchronisierte Strategien die Volatilität des Kryptomarktes verändern
Krypto-Händler im Einzelhandel stehen seit langem vor denselben Herausforderungen: schlechtes Risikomanagement, späte Einstiege, emotionale Entscheidungen und inkonsequente Ausführung. KI-Handelstools versprachen eine Lösung. Heute helfen KI-gestützte Copy-Trading-Systeme und Breakout-Bots Händlern, Positionen zu vergrößern, Stopps zu setzen und schneller als je zuvor zu handeln. Über Geschwindigkeit und Präzision hinaus verändern diese Tools die Märkte im Stillen – Trader handeln nicht nur intelligenter, sie bewegen sich synchron und schaffen eine neue Dynamik, die sowohl Risiken als auch Chancen verstärkt.
AI Trading in Crypto Erklärt: Wie autonomer Handel Kryptomärkte und Kryptobörsen verändert
KI-Handel verändert die Krypto-Landschaft rasant. Traditionelle Strategien haben Schwierigkeiten, mit der Nonstop-Volatilität und komplexen Marktstruktur von Krypto Schritt zu halten, während KI massive Daten verarbeiten, adaptive Strategien generieren, Risiken managen und Trades autonom ausführen kann. Dieser Artikel führt WEEX-Nutzer durch, was KI-Handel ist, warum Krypto seine Einführung beschleunigt, wie sich die Branche hin zu autonomen Agenten entwickelt und warum WEEX das KI-Handelsökosystem der nächsten Generation aufbaut.
Aufruf zur Teilnahme an AI Wars: WEEX Alpha Awakens — Globaler KI-Handelswettbewerb mit 880.000 US-Dollar Preispool
Jetzt rufen wir KI-Händler aus aller Welt dazu auf, sich AI Wars anzuschließen: WEEX Alpha Awakens, ein globaler KI-Handelswettbewerb mit 880.000 US-Dollar Preispool.
Beliebte Coins
Neueste Krypto-Nachrichten
Kundenservice:@weikecs
Geschäftliche Zusammenarbeit:@weikecs
Quant-Trading & MM:[email protected]
VIP-Services:[email protected]