
Understand the Market Like a Puzzle: Decoding the Inner Logic of Liquidity, Spread, and Market Movement
Original Article by: TradeStream | Improve Your Trading
Original Article Translated by: DeepFlow Tech
Trading: If we choose to act in a place where most people are willing to trade based on common sense... then this may mean that we do not have more valuable information than others.
One Metaphor of Market Behavior: Jigsaw Puzzle
I like to use a jigsaw puzzle to describe market behavior. You can imagine the overall market as a person trying to complete a puzzle, with the trading volume being the puzzle pieces. The market will strive to put all the pieces together. By analyzing the distribution of trading volume, we can more clearly see where "pieces" are missing. When the market finds areas with more pieces (i.e., higher trading volume and time accumulation), it will try to allocate these pieces to areas with fewer pieces (i.e., lower trading volume and time).
How the Market Chooses Direction
Sometimes, when both sides of the market lack "pieces," how can we determine which side it will fill first?
This reminds me of a theory about human behavior in the book "Atomic Habits." In such situations, we need to focus on two key points:
Attraction: People usually hope that their actions will bring rewards, and the market is the same because it reflects human behavioral patterns. As we discussed earlier, we tend to avoid overly crowded trading scenarios, and a more attractive strategy is often trading against the majority of mispositioned participants, especially when we have clear structural reasons.
Reducing Resistance: According to the "law of least effort," the more effort something requires, the less likely it is to happen. If the resistance is too high, the difficulty of achieving our goal will also increase.
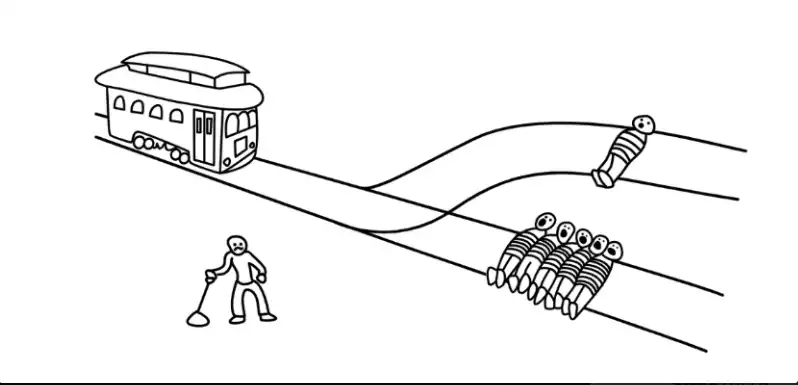
Another Metaphor of Market Behavior: Trolley Problem
Imagine the market as a train, and this train is like an "executioner" eager to "hunt." When we take action in the fair value area, both sides of the market are crowded with participants, making it difficult to predict which side the market will "hunt" more people. However, once the market chooses a side, the other side becomes the only choice, making our decision-making simpler.
What is Liquidity?
Liquidity refers to whether there are enough counterparties in the market to trade with. When we trade, we are either consuming liquidity or providing liquidity. If the price is stable in a certain area (i.e., a balance area) or unable to fluctuate smoothly, it is because buyers have not consumed enough liquidity; conversely, if the price can fluctuate smoothly, it means that buyers have successfully consumed enough liquidity.
Limit Order vs. Market Order
A limit order is a tool for "adding liquidity," while a market order is a tool for executing a trade and consuming this liquidity. Passive liquidity (limit orders) is often more impactful because limit orders typically determine market structure, while aggressive market orders will be absorbed at key points.
Why is a limit order more impactful? Because when you execute a market order, you need to cross the bid-ask spread, which means you will immediately be in an unrealized loss position after placing the order.
What is the Spread?
The spread is the difference between the asset's buy price (advertisement bid) and sell price (advertisement ask). Market makers provide liquidity through the spread, meaning the price to immediately buy an asset is usually slightly higher than the market price, while the price to immediately sell is slightly lower than the market price.

Let's assume an asset's current price is $10.00, and an asterisk (*) represents one contract. If we want to buy immediately, there is no $10.00 quote in the market because if there were, the market maker would not profit. Therefore, they would set the advertised liquidity slightly higher, for example, placing four contracts at $10.01 to capture this small difference.
If we decide to buy three contracts, we would transact at the $10.01 price. But what if we want to buy more, say 15 contracts? We would need to cross the spread until we find enough orders to fulfill the trade. As a result, the price would eventually be pushed to $10.03 because only at this price level are there enough contracts to meet our demand.

Through this example, we can understand why limit orders are usually more impactful. Small-scale traders have a negligible impact on the price as they will not encounter significant slippage. However, if someone wants to buy 500 contracts and there is not enough liquidity nearby, they will have to cross a significant spread, causing substantial price fluctuations.
If traders choose to place orders where liquidity is abundant, they can avoid significant slippage. So, where is liquidity usually concentrated? The answer is above swing highs and below swing lows. This is because most technical analysis-based traders exhibit similar behavior in setting stop-loss orders, and these locations are often where stop-losses cluster, making price reversals likely at these points.
So, their stop-loss is your entry point? Indeed.
Summary
· Impatient buyers or sellers are driving the price through market orders (taker), consuming liquidity.
· More patient buyers or sellers are preventing price fluctuations through limit orders (maker).
We can use a metaphor to describe this: market orders are like a hammer, while limit orders act as the floor or ceiling of a building. Breaking through the floor or ceiling requires sufficient hammer force to do so.

What happens when the floor is broken? The price quickly moves to the next floor.

Once the price reaches the next floor, upward movement becomes easier because the ceiling has been broken, creating a "gap" that allows the price to more easily fluctuate in areas of scarce liquidity.

Liquidity cascading is a very effective way to make money because at this point, we are trading with a price-insensitive group that is forced to transact (e.g., liquidated traders). But we need to be clear about what we are trading.
If you are trading liquidity premium, this effect is usually very short-lived, lasting a maximum of 10-15 seconds. In a cascading environment, this situation changes. In this case, you need to assess whether liquidity has fully recovered from the initial volatility.
Although the chain reaction of momentum shifts is not as reliable as liquidity premium, its sustainability is stronger (many people think they are trading liquidity premium when, in fact, they are trading this momentum effect).
The first method (liquidity premium) is more suitable for PNL attribution (i.e., analyzing the reason for making money) and is also the more ideal way to operate. The second method (momentum effect) captures the core part of large fluctuations but comes with greater volatility and looser risk control.
Overall, liquidity cascades lead to a supply-demand imbalance as a large number of price-insensitive traders enter, causing the order book to not withstand so many aggressive traders. But once the market stabilizes, the price will more easily return to those areas that failed to accumulate enough volume due to rapid fluctuations.
After all, the market is a two-way auction mechanism that usually tests low-volume areas for two reasons:
· There is less path resistance;
· The market seeks efficiency and will test these areas to see if anyone is willing to trade at those price levels.
As a result, the market will experience a "mechanical bounce back," as the order book needs time to rebalance. During this time, only a small amount of trading volume is needed to drive price fluctuations. Once the market settles, price movements will rely more on momentum, accompanied by increased volatility, but also allowing for greater profit potential.
Remember, high volatility often begets high volatility, while low volatility often begets low volatility, a phenomenon known as volatility clustering. Therefore, seize the opportunity and adjust your risk management strategy based on each change in market conditions.
猜你喜欢

2025年预测市场复盘:总交易额超500亿美元,双巨头市场份额超97.5%

左手BTC右手AI算力:数智时代的黄金与石油

五角大楼披萨指数飙升1250%:下个委内瑞拉会是谁?

从Manus肖弘说起,那些上桌的币圈实习生
币圈这些不常见的东西,都在闲鱼上
AOT Matrix 的实战进化:WEEX AI Trading Hackathon 下的双脑量化系统
在加密市场这一典型的“非平稳系统”中,策略失效往往不是因为模型不够复杂,而是因为它们并未真正经历真实市场的约束:剧烈波动、流动性断层、执行延迟、风控边界…… 这也是 WEEX 发起 AI Trading Hackathon 的核心初衷——不比概念,只看在真实交易环境中的可落地能力。在 WEEX AI Trading Hackathon 的备赛过程中,参赛团队 AOT Matrix 展现了前沿 AI 量化能力,通过 V4.4 双脑协同架构,实现了从底层逻辑到执行层的全面优化,充分体现了平台对创新与实战能力的双重考量。
告别「空气」投资:用这6大指标帮你选中爆款项目

USD1 30亿市值狂飙背后:特朗普家族押注、CEX托举

预测市场里的反常识买盘,谁在接你的对手单?

旧的山寨币剧本已过时,带你解读新的市场体制
AI Trading Risk in Cryptocurrency: Why Better Crypto Trading Strategies Can Create Bigger Losses?
风险不再主要在于决策失误或情绪错误。 它越来越多地生活在市场结构、执行路径和集体行为中。 理解这一转变比找到下一个“更好”的战略更重要。

250亿美元、6723轮融资,加密VC们2025年把钱投向哪了?

币权还是股权?真正的问题被问错了

Ranger公募玩出新花样,草根团队能赢得市场信任吗?
怀俄明州稳定币FRNT上线Solana、Polycule Bot 遭黑客攻击,海外币圈今天在聊啥?

Visa加密负责人:2026 Crypto与AI的八大演进方向
预赛选手解读——AOT Matrix:左脑分析,右脑决策的AI交易系统
在 WEEX AI Trading Hackathon 的参赛项目中,AOT Matrix 的系统设计选择了一条相对克制、但在真实交易环境下更难走的路径。在备赛初期,他们便围绕AI 在交易系统中的角色边界做出了明确取舍。围绕这一决策逻辑、系统架构的多次重构,以及在 WEEX 真实交易环境与工程约束下的实践过程,我们对 AOT Matrix 进行了采访。

Trend Research:2026超越范式,WLFI开启金融生态新纪元
2025年预测市场复盘:总交易额超500亿美元,双巨头市场份额超97.5%
左手BTC右手AI算力:数智时代的黄金与石油
五角大楼披萨指数飙升1250%:下个委内瑞拉会是谁?
从Manus肖弘说起,那些上桌的币圈实习生
币圈这些不常见的东西,都在闲鱼上
AOT Matrix 的实战进化:WEEX AI Trading Hackathon 下的双脑量化系统
在加密市场这一典型的“非平稳系统”中,策略失效往往不是因为模型不够复杂,而是因为它们并未真正经历真实市场的约束:剧烈波动、流动性断层、执行延迟、风控边界…… 这也是 WEEX 发起 AI Trading Hackathon 的核心初衷——不比概念,只看在真实交易环境中的可落地能力。在 WEEX AI Trading Hackathon 的备赛过程中,参赛团队 AOT Matrix 展现了前沿 AI 量化能力,通过 V4.4 双脑协同架构,实现了从底层逻辑到执行层的全面优化,充分体现了平台对创新与实战能力的双重考量。