
On-Chain Data School (Part Four): Visualizing BTC UTXO Age Price Distribution Chart
Original Article Title: "On-chain Data Classroom (Part 4): Visualizing the $BTC Chip Price Distribution Chart "
Original Article Author: Mr. Berg, On-chain Data Analyst
This article is the 4th in the On-chain Data Classroom series, which consists of 10 articles in total. Take you step by step to understand on-chain data analysis. Interested readers are welcome to follow this series of articles.
Related Reading: "On-chain Data Classroom (Part 3): Have the Bottom Fishing Whales Taken Profit?"
TLDR
- This article will introduce the on-chain metric URPD
- URPD shows the distribution of $BTC chips at different holding costs
- URPD can be used to observe chip turnover, distribution conditions, and provide guidance on trends
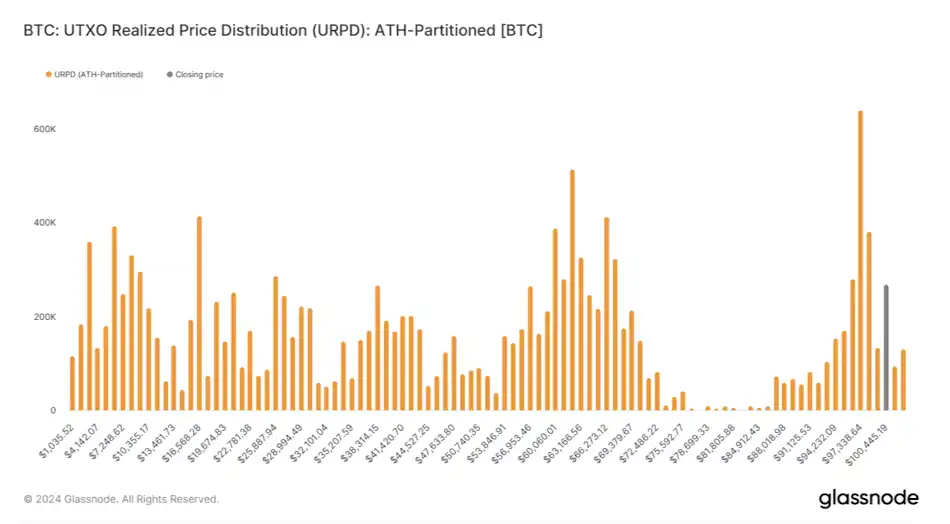
What is URPD?
URPD, short for UTXO Realized Price Distribution.
Due to BTC's unique UTXO blockchain structure,
we can track data on-chain that is unavailable in traditional financial markets.
The URPD chart is an indicator derived from this principle,
where we can see the number of chips corresponding to each price level on the chart,
equivalent to showing the "buying cost of each $BTC."
URPD, Chip Turnover, Accumulation, and Distribution
After understanding the concept of URPD,
we can then observe the turnover of chips at different price levels based on the daily URPD changes.
For example:
Chart one below is the URPD chart for May 1,
while chart two is the URPD chart for October 1.
After experiencing five months of wide-ranging fluctuations in price,
It is quite obvious to see the phenomenon of low-cost chips being distributed upwards.

URPD, Chip Turnover, Accumulation, and Distribution (2)
In history, at a market top, it is usually accompanied by the tail end of high-profit low-cost chip distribution;
while at a market bottom, a large amount of chips can be seen accumulating in a relatively narrow range.
Therefore, in analysis,
URPD is often observed together with other data (such as realized profit, MVRV, etc.),
integrating logical thinking to understand the market from a more comprehensive perspective.

Support, Resistance, Consensus
When a significant amount of chips begins to accumulate in a single price range,
it indicates that a supply-demand consensus has gradually formed in that range.
Once the price later rapidly rises out of that range,
due to the high turnover of chips in that range,
it is likely to provide support in the future;
Conversely, if the price falls below that range,
the chips in that range will become trapped chips,
which may act as resistance levels in future price increases.
Conclusion
The above is all the content of On-Chain Data School (Part Four). For readers interested in delving deeper into on-chain data analysis, remember to keep track of this series of articles!
If you want to see more analysis and educational content on on-chain data, feel free to follow my Twitter handle (X)!
Hope this article has been helpful to you. Thank you for reading.
猜你喜歡

這些新創公司正在無需資料中心的情況下建立先進AI模型
CEX與Wallet之後,OKX入局支付
RWA永續產品危機:為什麼GLP模式註定撐不住RWA永續?
專訪Virtuals聯創empty:AI 創業不需要大量資金,Crypto是答案之一
今年 2 月,Base 生態中的 AI 協議 Virtuals 宣布跨鏈至 Solana,然而加密市場隨後進入流動性緊縮期,AI Agent 板塊從人聲鼎沸轉為低迷,Virtuals 生態也陷入一段蟄伏期。
三月初,BlockBeats 對 Virtuals 共同創辦人 empty 進行了一次專訪。彼時,團隊尚未推出如今被廣泛討論的 Genesis Launch 機制,但已在內部持續探索如何透過機制設計激活舊資產、提高用戶參與度,並重構代幣發行與融資路徑。那是一個市場尚未復甦、生態尚處冷啟動階段的時間點,Virtuals 團隊卻沒有停下腳步,而是在努力尋找新的產品方向和敘事突破口。
兩個月過去,AI Agent 板塊重新升溫,Virtuals 代幣反彈超 150%,Genesis 機製成為帶動生態回暖的重要觸發器。從積分獲取規則的動態調整,到專案參與熱度的持續上升,再到「新代幣帶老代幣」的機制閉環,Virtuals 逐漸走出寒冬,並再次站上討論焦點。
值得注意的是,Virtuals 的 Genesis 機制與近期 Binance 推出的 Alpha 積分系統有一些相似之處,評估用戶在 Alpha 和幣安錢包生態系統內的參與度,決定用戶 Alpha 代幣空投的資格。用戶可透過持倉、交易等方式獲得積分,積分越高,參與新項目的機會越大。透過積分系統篩選使用者、分配資源,專案方能夠更有效地激勵社群參與,提升專案的公平性和透明度。 Virtuals 和 Binance 的探索,或許預示著加密融資的新趨勢正在形成。
回看這次對話,empty 在專訪中所展現出的思路與判斷,正在一步步顯現其前瞻性,這不僅是一場圍繞打新機制的訪談,更是一次關於“資產驅動型 AI 協議”的路徑構建與底層邏輯的深度討論。
BlockBeats:可以簡單分享一下最近團隊主要在忙些什麼?
empty:目前我們的工作重點主要有兩個部分。第一部分,我們希望將 Virtuals 打造成一個類似「華爾街」的代理人(Agent)服務平台。設想一下,如果你是專注於 Agent 或 Agent 團隊建立的創業者,從融資、發幣到流動性退出,整個流程都需要係統性的支援。我們希望為真正專注於 Agent 和 AI 研發的團隊,提供這一整套服務體系,讓他們可以把精力集中在底層能力的開發上,而不用為其他環節分心。這一塊的工作其實也包括了與散戶買賣相關的內容,後面可以再詳細展開。
第二部分,我們正在深入推進 AI 相關的佈局。我們的願景是建立一個 AI 社會,希望每個 Agent 都能聚焦自身優勢,同時透過彼此之間的協作,實現更大的價值。因此,最近我們發布了一個新的標準——ACP(Agent Communication Protocol),目的是讓不同的 Agent 能夠相互互動、協作,共同推動各自的業務目標。這是目前我們主要在推進的兩大方向。
BlockBeats:可以再展開說說嗎?
empty:在我看來,其實我們面對的客戶群可以分為三類:第一類是專注於開發 Agent 的團隊;第二類是投資者,包括散戶、基金等各種投資機構;第三類則是 C 端用戶,也就是最終使用 Agent 產品的個人用戶。
不過,我們主要的精力其實是放在前兩大類──也就是團隊和投資人。對於 C 端用戶這一塊,我們並不打算直接介入,而是希望各個 Agent 團隊能夠自己解決 C 端市場的拓展問題。
此外,我們也認為,Agent 與 Agent 之間的交互作用應該成為一個核心模式。簡單來說,就是未來的服務更多應該是由一個 Agent 銷售或提供給另一個 Agent,而不是單純賣給人類使用者。因此,在團隊的 BD 工作中,我們也積極幫助現有的 AI 團隊尋找這樣的客戶和合作機會。
BlockBeats:大概有一些什麼具體案例呢?
empty:「華爾街」說白了就是圍繞資本運作體系的建設,假設你是一個技術團隊,想要融資,傳統路徑是去找 VC 募資,拿到資金後開始發展。如果專案做得不錯,接下來可能會考慮進入二級市場,例如在紐約證券交易所上市,或是在 Binance 這樣的交易所上幣,實現流動性退出。
我們希望把這一整套流程打通-從早期融資,到專案開發過程中對資金的靈活使用需求,再到最終二級市場的流動性退出,全部覆蓋和完善,這是我們希望補齊的一條完整鏈條。
而這一部分的工作和 ACP(Agent Communication Protocol)是不同的,ACP 更多是關於 Agent 與 Agent 之間交互標準的製定,不直接涉及資本運作系統。
BlockBeats:它和現在 Virtuals 的這個 Launchpad 有什麼差別呢?資金也是從 C 端來是嗎?
empty:其實現在你在 Virtuals 上發幣,如果沒有真正融到資金,那就只是發了一個幣而已,實際是融不到錢的。我們目前能提供的服務,是透過設定買賣時的交易稅機制,從中提取一部分稅收回饋給創業者,希望這部分能成為他們的現金流來源。
不過,問題其實還分成兩塊。第一是如何真正幫助團隊完成融資,這個問題目前我們還沒有徹底解決。第二是關於目前專案發行模式本身存在的結構性問題。簡單來說,現在的版本有點像過去 Pumpfun 那種模式——也就是當專案剛上線時,部分籌碼就被外賣給了外部投資人。但現實是,目前整個市場上存在著太多機構集團和「狙擊手」。
當一個真正優秀的專案一發幣,還沒真正觸達普通散戶,就已經被機構在極高估值時搶購了。等到散戶能夠接觸到時,往往價格已經偏高,專案品質也可能變差,整個價值發行體係被扭曲。
針對這個問題,我們希望探索一種新的發幣和融資模式,目的是讓專案方的籌碼既不是死死握在自己手裡,也不是優先流向英文圈的大機構,而是能夠真正留給那些相信專案、願意長期支持專案的普通投資者手中。我們正在思考該如何設計這樣一個新的發行機制,來解決這個根本問題。
BlockBeats:新模式的具體想法會是什麼樣子呢?
empty:關於資金這一塊,其實我們目前還沒有完全想透。現階段來看,最直接的方式還是去找 VC 融資,或是採取公開預售等形式進行資金募集。不過說實話,我個人對傳統的公開預售模式並不是特別認同。
在「公平發售」這件事上,我們正在嘗試換一個角度來思考-希望能從「reputation」出發,重新設計機制。
具體來說,就是如果你對整個 Virtuals 生態有貢獻,例如早期參與、提供支持或建設,那麼你就可以在後續購買優質代幣時享有更高的優先權。透過這種方式,我們希望把資源更多留給真正支持生態發展的用戶,而不是由短期套利的人主導。
BlockBeats:您會不會考慮採用類似之前 Fjord Foundry 推出的 LBP 模式,或者像 Daos.fun 那種採用白名單機制的模式。這些模式在某種程度上,和您剛才提到的「對生態有貢獻的人享有優先權」的想法是有些相似的。不過,這類做法後來也引發了一些爭議,例如白名單內部操作、分配不公等問題。 Virtuals 在設計時會考慮借鏡這些模式的優點,或有針對性地規避類似的問題嗎?
empty:我認為白名單機制最大的問題在於,白名單的選擇權掌握在專案方手中。這和「老鼠倉」行為非常相似。專案方可以選擇將白名單名額分配給自己人或身邊的朋友,導致最終的籌碼仍然掌握在少數人手中。
我們希望做的,依然是類似白名單的機制,但不同的是,白名單的獲取權應基於一個公開透明的規則體系,而不是由項目方單方面決定。只有這樣,才能真正做到公平分配,避免內幕操作的問題。
我認為在今天這個 AI 時代,很多時候創業並不需要大量資金。我常跟團隊強調,你們應該優先考慮自力更生,例如透過組成社區,而不是一開始就想著去融資。因為一旦融資,實際上就等於背負了負債。
我們更希望從 Training Fee的角度去看待早期發展路徑。也就是說,專案可以選擇直接發幣,透過交易稅所帶來的現金流,支持日常營運。這樣一來,專案可以在公開建設的過程中獲得初步資金,而不是依賴外部投資。如果專案做大了,自然也會有機會透過二級市場流動性退出。
當然最理想的情況是,專案本身能夠有穩定的現金流來源,這樣甚至連自己的幣都無需拋售,這才是真正健康可持續的狀態。
我自己也常在和團隊交流時分享這種思路,很有意思的是,那些真正抱著「搞快錢」心態的項目,一聽到這種機制就失去了興趣。他們會覺得,在這種模式下,既無法操作老鼠倉,也很難短期套利,於是很快就選擇離開。
但從我們的角度來看,這其實反而是個很好的篩選機制。透過這種方式,理念不同的專案自然會被過濾出去,最後留下的,都是那些願意真正建立、和我們價值觀契合的團隊,一起把事情做起來。
BlockBeats:這個理念可以發展出一些能夠創造收益的 AI agent。
empty:我覺得這是很有必要的。坦白說,放眼今天的市場,真正擁有穩定現金流的產品幾乎鳳毛麟角,但我認為這並不意味著我們應該停止嘗試。事實上,我們每天在對接的團隊中,有至少一半以上的人依然懷抱著長遠的願景。很多時候,他們甚至已經提前向我們提供了 VC 階段的資金支持,或表達了強烈的合作意願。
其實對他們來說想要去收穫一個很好的社區,因為社區可以給他們的產品做更好的回饋,這才是他們真正的目的。這樣聽起來有一點匪夷所思,但其實真的有很多這樣的團隊,而那種團隊的是我們真的想扶持的團隊。
BlockBeats:您剛才提到的這套「AI 華爾街」的產品體系-從融資、發行到退出,建構的是一整套完整的流程。這套機制是否更多是為了激勵那些有意願發幣的團隊?還是說,它在設計上也考慮瞭如何更好地支持那些希望透過產品本身的現金流來發展的團隊?這兩類團隊在您這套體系中會不會被區別對待,或者說有什麼機制設計能讓不同路徑的創業者都能被合理支持?
empty:是的,我們 BD 的核心職責其實就是去鼓勵團隊發幣。說得直接一點,就是引導他們思考發幣的可能性和意義。所以團隊最常問的問題就是:「為什麼要發幣?」這時我們需要採取不同的方式和角度,去幫助他們理解背後的價值邏輯。當然如果最終判斷不適合,我們也不會強迫他們推進。
不過我們觀察到一個非常明顯的趨勢,傳統的融資路徑已經越來越難走通了。過去那種融資做大,發幣上所的模式已經逐漸失效。面對這樣的現實,很多團隊都陷入了尷尬的境地。而我們希望能從鏈上和加密的視角,提供一套不同的解決方案,讓他們找到新的發展路徑。
BlockBeats:明白,我剛才其實想表達的是,您剛剛也提到,傳統的 AI 模式在很大程度上仍然依賴「燒錢」競爭。但在 DeepSeek 出現之後,市場上一些資金體積較小的團隊或投資人開始重新燃起了信心,躍躍欲試地進入這個領域。您怎麼看待這種現象?這會不會對目前正在做 AI 基礎研發,或是 AI 應用層開發的團隊產生一定的影響?
empty:對,我覺得先不談 DeepSeek,從傳統角度來看,其實到目前為止,AI 領域真正賺錢的只有英偉達,其他幾乎所有玩家都還沒有實現盈利。所以其實沒有人真正享受了這個商業模式的成果,大家也仍在探索如何面對 C 端打造真正有產出的應用。
沒有哪個領域像幣圈一樣能如此快速獲得社群回饋。你一發幣,用戶就會主動去讀白皮書的每一個字,試試你產品的每個功能。
當然,這套機制並不適合所有人。例如有些 Agent 產品偏 Web2,對於幣圈用戶而言,可能感知不到其價值。因此,我也會鼓勵做 Agent 的團隊在 Virtuals 生態中認真思考,如何真正將 Crypto 作為自身產品的差異化要素加以運用與設計。
BlockBeats:這點我特別認同,在 Crypto 這個領域 AI 的迭代速度確實非常快,但這群用戶給予的回饋,真的是代表真實的市場需求嗎?或者說這些回饋是否真的符合更大眾化、更具規模性的需求?
empty:我覺得很多時候產品本身不應該是強行推廣給不適合的使用者群體。例如 AIXBT 最成功的一點就在於,它的用戶本身就是那群炒作他人內容的人,所以他們的使用行為是非常自然的,並不覺得是在被迫使用一個無聊的產品。 mass adoption 這個概念已經講了很多年,大家可能早就該放棄這個執念了。我們不如就認了,把東西賣給幣圈的人就好了。
BlockBeats:AI Agent 與 AI Agent 所對應的代幣之間,究竟應該是什麼樣的動態關係?
empty:對,我覺得這裡可以分成兩個核心點。首先其實不是在投資某個具體的 AI Agent,而是在投資背後經營這個 Agent 的團隊。你應該把它理解為一種更接近創投的思路:你投的是這個人,而不是他目前正在做的產品。因為產品本身是可以快速變化的,可能一個月後團隊會發現方向不對,立即調整。所以,這裡的「幣」本質上代表的是對團隊的信任,而不是某個特定 Agent 本身。
第二則是期望一旦某個 Agent 產品做出來後,未來它能真正產生現金流,或者有實際的使用場景(utility),從而讓對應的代幣具備賦能效應。
BlockBeats:您覺得有哪些賦能方式是目前還沒看到的,但未來可能出現、值得期待的?
empty:其實主要有兩塊,第一是比較常見的那種你要使用我的產品,就必須付費,或者使用代幣支付,從而間接實現對代幣的「軟銷毀」或消耗。
但我覺得更有趣的賦能方式,其實是在獲客成本的角度思考。也就是說,你希望你的用戶同時也是你的投資者,這樣他們就有動機去主動幫你推廣、吸引更多用戶。
BlockBeats:那基於這些觀點,您怎麼看 ai16z,在專案設計和代幣機制方面,似乎整體表現並不太樂觀?
empty:從一個很純粹的投資角度來看,撇開我們與他們之間的關係,其實很簡單。他們現在做的事情,對代幣本身沒有任何賦能。從開源的角度來看,一個開源模型本身是無法直接賦能代幣的。
但它仍然有價值的原因在於,它像一個期權(call option),也就是說,如果有一天他們突然決定要做一些事情,比如推出一個 launchpad,那麼那些提前知道、提前參與的人,可能會因此受益。
開發者未來確實有可能會使用他們的 Launchpad,只有在那一刻,代幣才會真正產生賦能。這是目前最大的一個問號——如果這個模式真的跑得通,我認為確實會非常強大,因為他們的確觸達了大量開發者。
但我個人還是有很多疑問。例如即使我是使用 Eliza 的開發者,也不代表我一定會選擇在他們的 Launchpad 上發幣。我會貨比三家,會比較。而且,做一個 Launchpad 和做一個開源框架,所需的產品能力和社群運作能力是完全不同的,這是另一個重要的不確定性。
BlockBeats:這種不同是體現在什麼地方呢?
empty:在 Virtuals 上我們幾乎每天都在處理客服相關的問題,只要有任何一個團隊在我們平台上發生 rug,即使與我們沒有直接關係,用戶也會第一時間來找我們投訴。
這時我們就必須出面安撫用戶,並思考如何降低 rug 的整體風險。一旦有團隊因為自己的代幣設計錯誤或技術失誤而被駭客攻擊、資產被盜,我們往往需要自掏腰包,確保他們的社群至少能拿回一點資金,以便專案能夠重新開始。這些項目方可能在技術上很強,但未必擅長代幣發行,結果因操作失誤被攻擊導致資產損失。只要涉及「被欺騙」相關的問題,對我們來說就已經是非常麻煩的事了,做這些工作跟做交易所的客服沒有太大差別。
另一方面,做 BD 也非常困難。優秀的團隊手上有很多選擇,他們可以選擇在 Pumpfun 或交易所上發幣,為什麼他們要來找我們,那這背後必須要有一整套支援體系,包括融資支援、技術協助、市場推廣等,每個環節都不能出問題。
BlockBeats:那我們就繼續沿著這個話題聊聊 Virtuals 目前的 Launchpad 業務。有一些社群成員在 Twitter 上統計了 Virtuals Launchpad 的整體獲利狀況,確實目前看起來獲利的項目比較少。接下來 Launchpad 還會是 Virtuals 的主要業務區嗎?還是說,未來的重心會逐漸轉向您剛才提到的「AI 華爾街」這條路徑?
empty:其實這兩塊本質上是一件事,是一整套體系的一部分,所以我們必須繼續推進。市場的波動是很正常的,我們始終要堅持的一點是:非常清楚地認識到我們的核心客戶是誰。我一直強調我們的客戶只有兩類——團隊。所以市場行情的好壞對我們來說並不是最重要的,關鍵是在每一個關鍵節點上,對於一個團隊來說,發幣的最佳選擇是否依然是我們 Virtuals。
BlockBeats:您會不會擔心「Crypto + AI」或「Crypto AI Agent」這一類敘事已經過去了?如果未來還有一輪多頭市場,您是否認為市場炒作的焦點可能已經不再是這些方向了?
empty:有可能啊,我覺得 it is what it is,這確實是有可能發生的,但這也屬於我們無法控制的範圍。不過如果你問我,在所有可能的趨勢中,哪個賽道更有機會長期保持領先,我仍然認為是 AI。從一個打德撲的角度來看,它仍然是最優選擇。
而且我們團隊的技術架構和底層能力其實早已搭建完成了,現在只是順勢而為而已。更重要的是,我們本身真的熱愛這件事,帶著好奇心去做這件事。每天早上醒來就有驅動力去研究最新的技術,這種狀態本身就挺讓人滿足的,對吧?
很多時候,大家不應該只看產品本身。實際上很多優秀的團隊,他們的基因決定了他們有在規則中勝出的能力——他們可能過去在做派盤交易時,每筆規模就是上百萬的操作,而這些團隊的 CEO,一年的薪資可能就有 100 萬美金。如果他們願意出來單幹項目,從天使投資或 VC 的視角來看,這本質上是用一個很划算的價格買到一個高品質的團隊。
更何況這些資產是 liquid 的,不是鎖倉狀態。如果你當下不急著用錢,完全可以在早期階段買進一些優秀團隊的代幣,靜靜等待他們去創造一些奇蹟,基本上就是這樣一個邏輯。
第16週鏈上數據:結構性供需失衡加劇,數據揭⽰下⼀輪上漲的堅實藍圖?
Sui Q1進階報告:BTCfi基建崛起、借貸協議爆發與執行分片未來
川普次子的加密生意經
SignalPlus宏觀分析:關稅撕裂的M2敘事與TradFi式FOMO的回歸
門羅幣市值一天暴增15億美元背後,為何駭客不再喜歡比特幣?
盤點10大新興Launchpad平台,誰能完成Pump.fun的顛覆?
懂王簽字後,美國哪些州在「乖乖」推進比特幣戰略儲備法案?
GoRich正式上線:鏈上交易零門檻,新手也能抓住100x Meme幣
PENGU觸底反彈發拉漲360%,胖企鵝如何靠IP行銷迎第二春?
「打新帶老」:Genesis Launch如何用積分制重建AI Agent打新邏輯?
Arthur Hayes最新訪談:漲勢能否持續?誰能跑贏BTC?選幣邏輯是什麼?
專訪AllianceDAO合夥人qw:Crypto創業家正逃向AI,90%的Crypto+AI都是偽命題
AI賽道重拾熱度,全面整理潛力專案與市場炒作邏輯
穩定幣爭霸戰:六路新銳殺出,市場格局生變?
這些新創公司正在無需資料中心的情況下建立先進AI模型
CEX與Wallet之後,OKX入局支付
RWA永續產品危機:為什麼GLP模式註定撐不住RWA永續?
專訪Virtuals聯創empty:AI 創業不需要大量資金,Crypto是答案之一
今年 2 月,Base 生態中的 AI 協議 Virtuals 宣布跨鏈至 Solana,然而加密市場隨後進入流動性緊縮期,AI Agent 板塊從人聲鼎沸轉為低迷,Virtuals 生態也陷入一段蟄伏期。
三月初,BlockBeats 對 Virtuals 共同創辦人 empty 進行了一次專訪。彼時,團隊尚未推出如今被廣泛討論的 Genesis Launch 機制,但已在內部持續探索如何透過機制設計激活舊資產、提高用戶參與度,並重構代幣發行與融資路徑。那是一個市場尚未復甦、生態尚處冷啟動階段的時間點,Virtuals 團隊卻沒有停下腳步,而是在努力尋找新的產品方向和敘事突破口。
兩個月過去,AI Agent 板塊重新升溫,Virtuals 代幣反彈超 150%,Genesis 機製成為帶動生態回暖的重要觸發器。從積分獲取規則的動態調整,到專案參與熱度的持續上升,再到「新代幣帶老代幣」的機制閉環,Virtuals 逐漸走出寒冬,並再次站上討論焦點。
值得注意的是,Virtuals 的 Genesis 機制與近期 Binance 推出的 Alpha 積分系統有一些相似之處,評估用戶在 Alpha 和幣安錢包生態系統內的參與度,決定用戶 Alpha 代幣空投的資格。用戶可透過持倉、交易等方式獲得積分,積分越高,參與新項目的機會越大。透過積分系統篩選使用者、分配資源,專案方能夠更有效地激勵社群參與,提升專案的公平性和透明度。 Virtuals 和 Binance 的探索,或許預示著加密融資的新趨勢正在形成。
回看這次對話,empty 在專訪中所展現出的思路與判斷,正在一步步顯現其前瞻性,這不僅是一場圍繞打新機制的訪談,更是一次關於“資產驅動型 AI 協議”的路徑構建與底層邏輯的深度討論。
BlockBeats:可以簡單分享一下最近團隊主要在忙些什麼?
empty:目前我們的工作重點主要有兩個部分。第一部分,我們希望將 Virtuals 打造成一個類似「華爾街」的代理人(Agent)服務平台。設想一下,如果你是專注於 Agent 或 Agent 團隊建立的創業者,從融資、發幣到流動性退出,整個流程都需要係統性的支援。我們希望為真正專注於 Agent 和 AI 研發的團隊,提供這一整套服務體系,讓他們可以把精力集中在底層能力的開發上,而不用為其他環節分心。這一塊的工作其實也包括了與散戶買賣相關的內容,後面可以再詳細展開。
第二部分,我們正在深入推進 AI 相關的佈局。我們的願景是建立一個 AI 社會,希望每個 Agent 都能聚焦自身優勢,同時透過彼此之間的協作,實現更大的價值。因此,最近我們發布了一個新的標準——ACP(Agent Communication Protocol),目的是讓不同的 Agent 能夠相互互動、協作,共同推動各自的業務目標。這是目前我們主要在推進的兩大方向。
BlockBeats:可以再展開說說嗎?
empty:在我看來,其實我們面對的客戶群可以分為三類:第一類是專注於開發 Agent 的團隊;第二類是投資者,包括散戶、基金等各種投資機構;第三類則是 C 端用戶,也就是最終使用 Agent 產品的個人用戶。
不過,我們主要的精力其實是放在前兩大類──也就是團隊和投資人。對於 C 端用戶這一塊,我們並不打算直接介入,而是希望各個 Agent 團隊能夠自己解決 C 端市場的拓展問題。
此外,我們也認為,Agent 與 Agent 之間的交互作用應該成為一個核心模式。簡單來說,就是未來的服務更多應該是由一個 Agent 銷售或提供給另一個 Agent,而不是單純賣給人類使用者。因此,在團隊的 BD 工作中,我們也積極幫助現有的 AI 團隊尋找這樣的客戶和合作機會。
BlockBeats:大概有一些什麼具體案例呢?
empty:「華爾街」說白了就是圍繞資本運作體系的建設,假設你是一個技術團隊,想要融資,傳統路徑是去找 VC 募資,拿到資金後開始發展。如果專案做得不錯,接下來可能會考慮進入二級市場,例如在紐約證券交易所上市,或是在 Binance 這樣的交易所上幣,實現流動性退出。
我們希望把這一整套流程打通-從早期融資,到專案開發過程中對資金的靈活使用需求,再到最終二級市場的流動性退出,全部覆蓋和完善,這是我們希望補齊的一條完整鏈條。
而這一部分的工作和 ACP(Agent Communication Protocol)是不同的,ACP 更多是關於 Agent 與 Agent 之間交互標準的製定,不直接涉及資本運作系統。
BlockBeats:它和現在 Virtuals 的這個 Launchpad 有什麼差別呢?資金也是從 C 端來是嗎?
empty:其實現在你在 Virtuals 上發幣,如果沒有真正融到資金,那就只是發了一個幣而已,實際是融不到錢的。我們目前能提供的服務,是透過設定買賣時的交易稅機制,從中提取一部分稅收回饋給創業者,希望這部分能成為他們的現金流來源。
不過,問題其實還分成兩塊。第一是如何真正幫助團隊完成融資,這個問題目前我們還沒有徹底解決。第二是關於目前專案發行模式本身存在的結構性問題。簡單來說,現在的版本有點像過去 Pumpfun 那種模式——也就是當專案剛上線時,部分籌碼就被外賣給了外部投資人。但現實是,目前整個市場上存在著太多機構集團和「狙擊手」。
當一個真正優秀的專案一發幣,還沒真正觸達普通散戶,就已經被機構在極高估值時搶購了。等到散戶能夠接觸到時,往往價格已經偏高,專案品質也可能變差,整個價值發行體係被扭曲。
針對這個問題,我們希望探索一種新的發幣和融資模式,目的是讓專案方的籌碼既不是死死握在自己手裡,也不是優先流向英文圈的大機構,而是能夠真正留給那些相信專案、願意長期支持專案的普通投資者手中。我們正在思考該如何設計這樣一個新的發行機制,來解決這個根本問題。
BlockBeats:新模式的具體想法會是什麼樣子呢?
empty:關於資金這一塊,其實我們目前還沒有完全想透。現階段來看,最直接的方式還是去找 VC 融資,或是採取公開預售等形式進行資金募集。不過說實話,我個人對傳統的公開預售模式並不是特別認同。
在「公平發售」這件事上,我們正在嘗試換一個角度來思考-希望能從「reputation」出發,重新設計機制。
具體來說,就是如果你對整個 Virtuals 生態有貢獻,例如早期參與、提供支持或建設,那麼你就可以在後續購買優質代幣時享有更高的優先權。透過這種方式,我們希望把資源更多留給真正支持生態發展的用戶,而不是由短期套利的人主導。
BlockBeats:您會不會考慮採用類似之前 Fjord Foundry 推出的 LBP 模式,或者像 Daos.fun 那種採用白名單機制的模式。這些模式在某種程度上,和您剛才提到的「對生態有貢獻的人享有優先權」的想法是有些相似的。不過,這類做法後來也引發了一些爭議,例如白名單內部操作、分配不公等問題。 Virtuals 在設計時會考慮借鏡這些模式的優點,或有針對性地規避類似的問題嗎?
empty:我認為白名單機制最大的問題在於,白名單的選擇權掌握在專案方手中。這和「老鼠倉」行為非常相似。專案方可以選擇將白名單名額分配給自己人或身邊的朋友,導致最終的籌碼仍然掌握在少數人手中。
我們希望做的,依然是類似白名單的機制,但不同的是,白名單的獲取權應基於一個公開透明的規則體系,而不是由項目方單方面決定。只有這樣,才能真正做到公平分配,避免內幕操作的問題。
我認為在今天這個 AI 時代,很多時候創業並不需要大量資金。我常跟團隊強調,你們應該優先考慮自力更生,例如透過組成社區,而不是一開始就想著去融資。因為一旦融資,實際上就等於背負了負債。
我們更希望從 Training Fee的角度去看待早期發展路徑。也就是說,專案可以選擇直接發幣,透過交易稅所帶來的現金流,支持日常營運。這樣一來,專案可以在公開建設的過程中獲得初步資金,而不是依賴外部投資。如果專案做大了,自然也會有機會透過二級市場流動性退出。
當然最理想的情況是,專案本身能夠有穩定的現金流來源,這樣甚至連自己的幣都無需拋售,這才是真正健康可持續的狀態。
我自己也常在和團隊交流時分享這種思路,很有意思的是,那些真正抱著「搞快錢」心態的項目,一聽到這種機制就失去了興趣。他們會覺得,在這種模式下,既無法操作老鼠倉,也很難短期套利,於是很快就選擇離開。
但從我們的角度來看,這其實反而是個很好的篩選機制。透過這種方式,理念不同的專案自然會被過濾出去,最後留下的,都是那些願意真正建立、和我們價值觀契合的團隊,一起把事情做起來。
BlockBeats:這個理念可以發展出一些能夠創造收益的 AI agent。
empty:我覺得這是很有必要的。坦白說,放眼今天的市場,真正擁有穩定現金流的產品幾乎鳳毛麟角,但我認為這並不意味著我們應該停止嘗試。事實上,我們每天在對接的團隊中,有至少一半以上的人依然懷抱著長遠的願景。很多時候,他們甚至已經提前向我們提供了 VC 階段的資金支持,或表達了強烈的合作意願。
其實對他們來說想要去收穫一個很好的社區,因為社區可以給他們的產品做更好的回饋,這才是他們真正的目的。這樣聽起來有一點匪夷所思,但其實真的有很多這樣的團隊,而那種團隊的是我們真的想扶持的團隊。
BlockBeats:您剛才提到的這套「AI 華爾街」的產品體系-從融資、發行到退出,建構的是一整套完整的流程。這套機制是否更多是為了激勵那些有意願發幣的團隊?還是說,它在設計上也考慮瞭如何更好地支持那些希望透過產品本身的現金流來發展的團隊?這兩類團隊在您這套體系中會不會被區別對待,或者說有什麼機制設計能讓不同路徑的創業者都能被合理支持?
empty:是的,我們 BD 的核心職責其實就是去鼓勵團隊發幣。說得直接一點,就是引導他們思考發幣的可能性和意義。所以團隊最常問的問題就是:「為什麼要發幣?」這時我們需要採取不同的方式和角度,去幫助他們理解背後的價值邏輯。當然如果最終判斷不適合,我們也不會強迫他們推進。
不過我們觀察到一個非常明顯的趨勢,傳統的融資路徑已經越來越難走通了。過去那種融資做大,發幣上所的模式已經逐漸失效。面對這樣的現實,很多團隊都陷入了尷尬的境地。而我們希望能從鏈上和加密的視角,提供一套不同的解決方案,讓他們找到新的發展路徑。
BlockBeats:明白,我剛才其實想表達的是,您剛剛也提到,傳統的 AI 模式在很大程度上仍然依賴「燒錢」競爭。但在 DeepSeek 出現之後,市場上一些資金體積較小的團隊或投資人開始重新燃起了信心,躍躍欲試地進入這個領域。您怎麼看待這種現象?這會不會對目前正在做 AI 基礎研發,或是 AI 應用層開發的團隊產生一定的影響?
empty:對,我覺得先不談 DeepSeek,從傳統角度來看,其實到目前為止,AI 領域真正賺錢的只有英偉達,其他幾乎所有玩家都還沒有實現盈利。所以其實沒有人真正享受了這個商業模式的成果,大家也仍在探索如何面對 C 端打造真正有產出的應用。
沒有哪個領域像幣圈一樣能如此快速獲得社群回饋。你一發幣,用戶就會主動去讀白皮書的每一個字,試試你產品的每個功能。
當然,這套機制並不適合所有人。例如有些 Agent 產品偏 Web2,對於幣圈用戶而言,可能感知不到其價值。因此,我也會鼓勵做 Agent 的團隊在 Virtuals 生態中認真思考,如何真正將 Crypto 作為自身產品的差異化要素加以運用與設計。
BlockBeats:這點我特別認同,在 Crypto 這個領域 AI 的迭代速度確實非常快,但這群用戶給予的回饋,真的是代表真實的市場需求嗎?或者說這些回饋是否真的符合更大眾化、更具規模性的需求?
empty:我覺得很多時候產品本身不應該是強行推廣給不適合的使用者群體。例如 AIXBT 最成功的一點就在於,它的用戶本身就是那群炒作他人內容的人,所以他們的使用行為是非常自然的,並不覺得是在被迫使用一個無聊的產品。 mass adoption 這個概念已經講了很多年,大家可能早就該放棄這個執念了。我們不如就認了,把東西賣給幣圈的人就好了。
BlockBeats:AI Agent 與 AI Agent 所對應的代幣之間,究竟應該是什麼樣的動態關係?
empty:對,我覺得這裡可以分成兩個核心點。首先其實不是在投資某個具體的 AI Agent,而是在投資背後經營這個 Agent 的團隊。你應該把它理解為一種更接近創投的思路:你投的是這個人,而不是他目前正在做的產品。因為產品本身是可以快速變化的,可能一個月後團隊會發現方向不對,立即調整。所以,這裡的「幣」本質上代表的是對團隊的信任,而不是某個特定 Agent 本身。
第二則是期望一旦某個 Agent 產品做出來後,未來它能真正產生現金流,或者有實際的使用場景(utility),從而讓對應的代幣具備賦能效應。
BlockBeats:您覺得有哪些賦能方式是目前還沒看到的,但未來可能出現、值得期待的?
empty:其實主要有兩塊,第一是比較常見的那種你要使用我的產品,就必須付費,或者使用代幣支付,從而間接實現對代幣的「軟銷毀」或消耗。
但我覺得更有趣的賦能方式,其實是在獲客成本的角度思考。也就是說,你希望你的用戶同時也是你的投資者,這樣他們就有動機去主動幫你推廣、吸引更多用戶。
BlockBeats:那基於這些觀點,您怎麼看 ai16z,在專案設計和代幣機制方面,似乎整體表現並不太樂觀?
empty:從一個很純粹的投資角度來看,撇開我們與他們之間的關係,其實很簡單。他們現在做的事情,對代幣本身沒有任何賦能。從開源的角度來看,一個開源模型本身是無法直接賦能代幣的。
但它仍然有價值的原因在於,它像一個期權(call option),也就是說,如果有一天他們突然決定要做一些事情,比如推出一個 launchpad,那麼那些提前知道、提前參與的人,可能會因此受益。
開發者未來確實有可能會使用他們的 Launchpad,只有在那一刻,代幣才會真正產生賦能。這是目前最大的一個問號——如果這個模式真的跑得通,我認為確實會非常強大,因為他們的確觸達了大量開發者。
但我個人還是有很多疑問。例如即使我是使用 Eliza 的開發者,也不代表我一定會選擇在他們的 Launchpad 上發幣。我會貨比三家,會比較。而且,做一個 Launchpad 和做一個開源框架,所需的產品能力和社群運作能力是完全不同的,這是另一個重要的不確定性。
BlockBeats:這種不同是體現在什麼地方呢?
empty:在 Virtuals 上我們幾乎每天都在處理客服相關的問題,只要有任何一個團隊在我們平台上發生 rug,即使與我們沒有直接關係,用戶也會第一時間來找我們投訴。
這時我們就必須出面安撫用戶,並思考如何降低 rug 的整體風險。一旦有團隊因為自己的代幣設計錯誤或技術失誤而被駭客攻擊、資產被盜,我們往往需要自掏腰包,確保他們的社群至少能拿回一點資金,以便專案能夠重新開始。這些項目方可能在技術上很強,但未必擅長代幣發行,結果因操作失誤被攻擊導致資產損失。只要涉及「被欺騙」相關的問題,對我們來說就已經是非常麻煩的事了,做這些工作跟做交易所的客服沒有太大差別。
另一方面,做 BD 也非常困難。優秀的團隊手上有很多選擇,他們可以選擇在 Pumpfun 或交易所上發幣,為什麼他們要來找我們,那這背後必須要有一整套支援體系,包括融資支援、技術協助、市場推廣等,每個環節都不能出問題。
BlockBeats:那我們就繼續沿著這個話題聊聊 Virtuals 目前的 Launchpad 業務。有一些社群成員在 Twitter 上統計了 Virtuals Launchpad 的整體獲利狀況,確實目前看起來獲利的項目比較少。接下來 Launchpad 還會是 Virtuals 的主要業務區嗎?還是說,未來的重心會逐漸轉向您剛才提到的「AI 華爾街」這條路徑?
empty:其實這兩塊本質上是一件事,是一整套體系的一部分,所以我們必須繼續推進。市場的波動是很正常的,我們始終要堅持的一點是:非常清楚地認識到我們的核心客戶是誰。我一直強調我們的客戶只有兩類——團隊。所以市場行情的好壞對我們來說並不是最重要的,關鍵是在每一個關鍵節點上,對於一個團隊來說,發幣的最佳選擇是否依然是我們 Virtuals。
BlockBeats:您會不會擔心「Crypto + AI」或「Crypto AI Agent」這一類敘事已經過去了?如果未來還有一輪多頭市場,您是否認為市場炒作的焦點可能已經不再是這些方向了?
empty:有可能啊,我覺得 it is what it is,這確實是有可能發生的,但這也屬於我們無法控制的範圍。不過如果你問我,在所有可能的趨勢中,哪個賽道更有機會長期保持領先,我仍然認為是 AI。從一個打德撲的角度來看,它仍然是最優選擇。
而且我們團隊的技術架構和底層能力其實早已搭建完成了,現在只是順勢而為而已。更重要的是,我們本身真的熱愛這件事,帶著好奇心去做這件事。每天早上醒來就有驅動力去研究最新的技術,這種狀態本身就挺讓人滿足的,對吧?
很多時候,大家不應該只看產品本身。實際上很多優秀的團隊,他們的基因決定了他們有在規則中勝出的能力——他們可能過去在做派盤交易時,每筆規模就是上百萬的操作,而這些團隊的 CEO,一年的薪資可能就有 100 萬美金。如果他們願意出來單幹項目,從天使投資或 VC 的視角來看,這本質上是用一個很划算的價格買到一個高品質的團隊。
更何況這些資產是 liquid 的,不是鎖倉狀態。如果你當下不急著用錢,完全可以在早期階段買進一些優秀團隊的代幣,靜靜等待他們去創造一些奇蹟,基本上就是這樣一個邏輯。